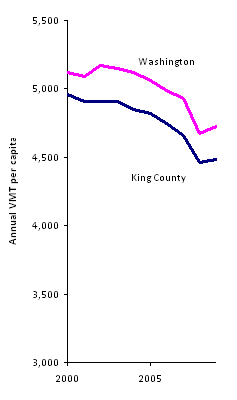
 Following up on the post on declining traffic volumes from a few days back, I looked a bit more closely at the traffic figures for Washington state, comparing them with the brand new Census population counts for Washington counties. And I also did my best to adjust for a methodology change that the state DOT made in 2004 to measure traffic more accurately.
The end result is the same: in the largest Washington counties, traffic volumes are either at or below their peaks earlier in the decade. And the per capita demand for vehicle travel fell by about 8% statewide between 2000 and 2009.
In King County—home to Seattle—total traffic volumes on state highways seem to have peaked in 2003. But per capita vehicle travel declined steadily through the entire decade, for a total decline of about 10%.
Here are some numbers since 2000 for the largest urban counties in Washington:
