fbpx
Donate Newsletters

WSDOT vs. Reality

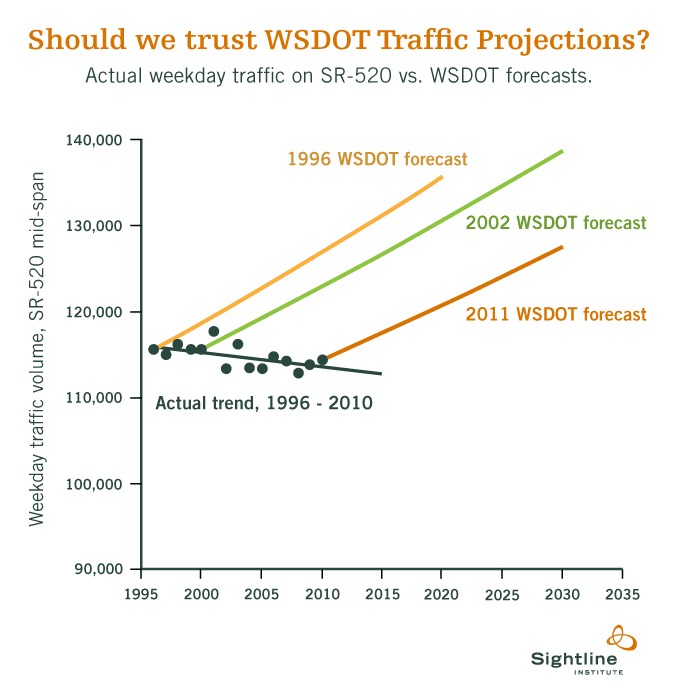
I wish I were making this up. The Washington State Department of Transportation continues to insist that traffic volumes on the SR-520 bridge across Lake Washington are going up up up—even though actual traffic volumes have been flat or declining for more than a decade!  Here’s a chart that makes the point.


In a charitable mood, you could forgive the 1996 projections.  Back then, rapid traffic growth on SR-520 was a recent memory: up through about 1988, traffic growth was both steady and rapid.

By 2011, however, it should have been perfectly obvious that the old predictions were proving inaccurate. Yet WSDOT just kept doubling down on their mistakes—insisting that their vision of the future remained clear, even as their track record was looking worse and worse.  So now they’ve wound up with an official traffic forecast, in the final Environmental Impact Statement no less, that doesn’t even pass the laugh test.

It would be funny—if the state weren’t planning billions in new highway investments in greater Seattle, based largely on the perceived “need” to accommodate all the new traffic that the models are predicting will show up, any day now.
Read more

The Tolled Tunnel: Almost An Earthquake?

The Final Environmental Impact Statement for the Alaskan Way Viaduct replacement project just came out, and it’s a MASSIVE document: 286 pages in the main report, plus a whopping 23 appendices.  The transportation discipline report (Appendix C) alone runs to 664 pages.  I haven’t actually counted all the pages, but I have to assume that they run into the thousands.

With that much ink devoted to the project, I’m sure that people on all sides of the debate can find tidbits to support their particular point of view.  But the tidbits I’m most interested in center on my current obsession:  what happens when you toll a single link in a big urban transportation network?

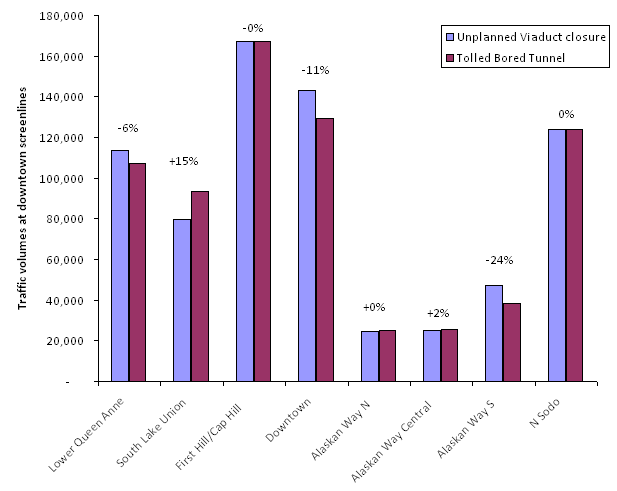
To its credit, the EIS does take a look at how tolling could affect traffic flows on city streets. The results?  In a nutshell, the state’s traffic models suggest that, from the perspective of traffic on city streets, the tolled tunnel is only a bit better than an earthquake that closes the Viaduct for good.  Here are some numbers, culled from Appendix C:

Traffic volumes: earthquake vs. tolled tunnel
Source: Viaduct Final EIS, Appendix C.

As you can see, compared with an earthquake that closes the Viaduct, the state says that the tolled bored tunnel would modestly reduce traffic volumes in lower Queen Anne, on streets in the downtown core, and reduce them a bit more in Alaskan Way through Sodo. But the bored tunnel would make traffic a little worse in South Lake Union. And it’s basically the same as an earthquake for the waterfront, First Hill and Capitol Hill, and traffic crossing between Sodo and the ID/Pioneer Square.  (Click on the map to the right for a larger map of where those screenlines are.)

Other parts of the transportation appendix show that the bored tunnel, with tolls, would reduce total traffic delays by about 6 percent in “Seattle’s Center City,” compared with an earthquake. That’s not nothing, but it’s not a lot either.  In fact, in terms of center city traffic delays, the tolled bored tunnel is actually one of the worst performers among the options studied.

Now for the caveats:

Read more

Dude Where Are My Cars: Tacoma Narrows Bridge

Interesting: tolling revenues on the Tacoma Narrows Bridge are starting to seriously lag behind the official projections.

Of course, the blue bars on the chart shows toll revenues, not traffic volumes. Unfortunately, the state hasn’t reported traffic counts in a while. And since revenues don’t always move in lock step with traffic counts (because tolling rates vary depending on vehicle size and payment method), I can only assume that traffic volumes are also falling short of projections.

Where Are My Cars: King County

I said I wouldn’t post a new one for a while, but apparently I just can’t help myself.  Here’s a chart of VMT per capita in King County, Washington, based on data provided by the state department of transportation.  (Here’s the VMT data, and the population counts.) As you can see, total vehicle travel in the county … Read more

Where Are My Cars: Seattle Traffic

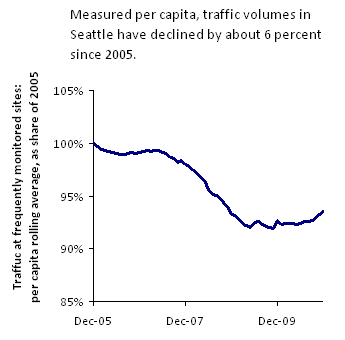
Seattle per capita traffic chartOK, I swear, this is the last one of this series I’m going to post for a while. But a helpful staffer from the Seattle Department of Transportation was kind enough to send me the city’s traffic “tube count” database. (Thanks, Vince!) And after I played around with the numbers for a while, the chart to the right popped out—showing that, person for person, Seattle residents are driving less than they used to.

As far as I can tell, per capita traffic volumes are down about six percent over five years. Most of that decline took place during 2008, when gas prices spiked and the economy tanked. But even as gas prices plummeted and Seattle’s economy picked itself up a bit, driving ticked upwards only a hair.

The total traffic volumes tell a similar story—rapid decline during 2008, and ending 2010 only a wee bit below where they stood at the end of 2005. And, of course, the numbers I have end in December of 2010—so they don’t reflect any reductions in driving from the most recent round of gas price spikes.

The reason I’ve been so obsessed with traffic trends—with five posts in two months—is that so many of the Northwest’s highway projects are being touted as the solution to our ever-worsening traffic woes. If we don’t build new roads, we’re told, the traffic models predict that we’ll be mired in gridlock. But the gridlock isn’t actually a prediction. It’s more like an assumption, built into the structure of the models themselves. In essence he models take it as a given that as the region grows and becomes more prosperous, people will drive more. That’s what they did last century, right? But over the last decade, we’ve seen a very different—and very surprising—pattern: in case after case after case, traffic volumes are flattening out. They’re growing slower than the models predicted—or they aren’t growing at all.

All of which raises the question: should we really be spending so much money expanding our road network if the demand isn’t actually there anymore? Couldn’t we be doing something a little smarter with our limited dollars?

Read more

Where Are My Cars: SR-520 and I-90 Across Lake Washington

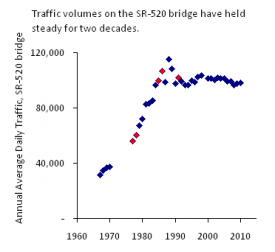
Well, this is the weirdest of our whole series on traffic trends:   the number of cars and trucks crossing the SR-520 bridge across Lake Washington has held steady for…wait for it…more than 20 years.   It was hard for me to believe at first, but it’s the only conclusion you can reach from the state’s Annual Traffic Report series.

In the chart to the right, the red points were marked as “estimates” by WSDOT.   The blue dots were the state’s direct counts of actual traffic volumes, averaged over the year.  I have no idea how to explain the spike in the late 1980s. [Update: looking at the original pdfs, that spike appears to be an error; WSDOT’s numbers for 1988 through 1992 show several serious anomalies. Also the spike occurred when the state was switching methods of counting traffic volumes on 520, moving from axle counts to vehicle counts.]  But the astonishing fact is that average daily traffic volumes on the SR-520 bridge were about the same in 2010 as in 1985. And traffic volumes have held roughly constant—with a few modest ups and downs—since 1990.

Given what’s happened over the last few decades, it seems like a pretty safe assumption that if the bridge remained in its current configuration, traffic volumes would continue to hold steady, rather than climbing inexorably upwards.

And yet, the state’s transportation models—the ones used to justify a project to widen the bridge—show that traffic volumes on the SR-520 bridge are going to go up, starting soon. Take a look at Exhibits 5.1-1, 5.1-2, and 5.1-3, in Chapter 5 of the state’s SR-520 SDEIS.  It shows that the state is predicting that traffic throughput on the bridge will grow between now and 2030.  Yet those predictions of ever-increasing traffic seem to be directly at odds with the fact that SR-520 traffic volumes in 2010 were five percent below what they were in 1998—the most recent peak.

Read more

Where Are My Cars: Columbia River Crossing

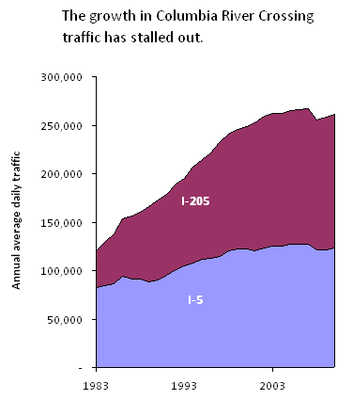
Continuing my obsession with the ever-mounting evidence that traffic volumes are growing much, much slower than transportation planners had expected, I present to you:   Traffic volumes on the I-5 and I-205 bridges across the Columbia River, with data courtesy of the Washington State Department of Transportation’s Annual Traffic Report series.

In case it’s not obvious from the chart, traffic on the two highways combined was a wee bit lower in 2010 than it was in 2003.   Much of that decline was due to the sharp drop-off in 2008, when gas prices were high and the economy tanked.

But if you look even closer at the numbers, you’ll see something else:   in about 2000, the growth in traffic over the Columbia started to stall out.   Before then, traffic grew by an average of about 5 percent per year.   Since the new millennium, though, annual traffic growth has averaged about 0.5 percent.   Even if you exclude the declines in 2008, traffic grew at only about 1 percent per year starting in 2000.

That’s for the two highway bridges together.   If you look just at the I-5 span across the Columbia, traffic volumes in 2010 were just a hair above what they were in 1999.   That’s more than a decade with essentially no growth in traffic!!

Read more

Where Are My Cars: I-5 Through Seattle

Remarkably enough, state figures show that traffic on I-5 through Seattle declined pretty steadily from 2003 through 2009.  Take a look at the chart to the right.  In total, traffic volumes on I-5 across the ship canal bridge fell by well over 7 percent.  Remember, this is total traffic, not per capita.  The per capita … Read more

Where Are My Cars: Golden Ears Bridge Edition

Following up on last month’s post on declining traffic volumes in Northwest cities, there’s this new news on the Golden Ears Bridge outside Vancouver, BC: [O]fficials are trying to lure drivers to the Golden Ears Bridge between Maple Ridge and Langley with reduced tolls on off-peak hours. Tolls will be slashed by 30 per cent … Read more