fbpx
Donate Newsletters

Gas Consumption Shifting Into Reverse?

Many Northwest drivers are preparing to top up their tanks for travel this Labor Day weekend—and will pay dearly for the privilege. But there’s new evidence that high fuel prices are curbing our appetite for gas.

We detail the evidence in our latest report: Shifting Into Reverse. According to state and federal data, total gasoline consumption in Oregon and Washington in 2011 was about 4 percent lower than it was in 2002—the year that overall motor fuel consumption in the two states peaked. And early data suggests that high prices in the first part of 2012 sent fuel consumption even lower this year.
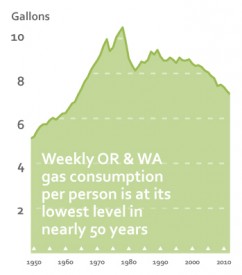
Meanwhile, the region’s population keeps growing—which means that fuel consumption per person keeps falling. In fact, per capita gasoline consumption is now at its lowest level in nearly 50 years.

The chart to the right shows the long-term trends. Gas consumption per capita skyrocketed during the post-war period, up until the oil crisis of 1979—a year when oil prices spiked. That was followed by years of volatility as the Northwest economy cratered and recovered, and federal fuel economy standards ushered rapid efficiency gains in the vehicle fleet. In the late 1980s, fuel consumption per capita hit a bumpy plateau. But once gas prices started to rise in 1999, the region’s drivers have been consuming less and less gas.

Read more

Older Boomers, Less Driving

You’ve probably heard of Peak Oil, and maybe even Peak Fish. But have you heard of “Peak Middle Aged People”?

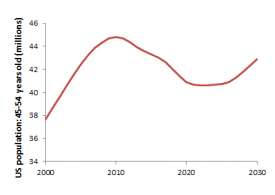
That’s right, the Census projects that the aging of the baby boomers is sending the population of 45-to-54 year-olds in the United States into reverse. In fact, that age group reached its near-term peak in 2010. Even as the overall population is expected to grow, we’ll actually have fewer 45-54 year olds in 2030 than we do today.

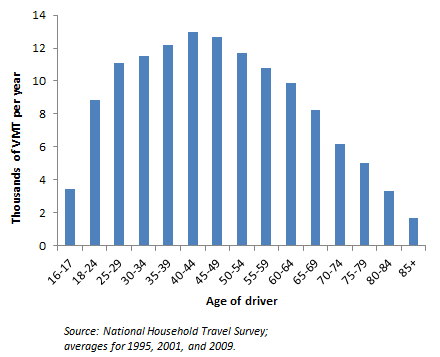
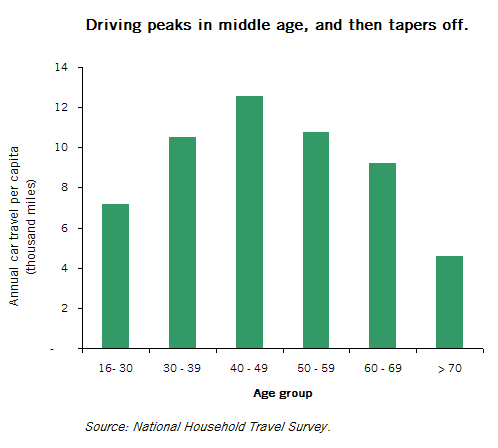
This demographic shift will almost certainly affect driving trends. According to each of the last three National Household Transportation Surveys, driving peaks in middle age. At age 54, you drive about as much as you did in your late twenties and early thirties…but after that, it’s a long, steady decline. Take a look at this chart of Vehicle Miles Traveled by drivers’ age:

This makes intuitive sense: folks in middle age are near the height of their earning power, are particularly likely to own a car, and often have demands from work or kids that boost their driving. But as people grow older, they’re more likely to retire, and less likely to have to schlep the kids to soccer practice.

Read more

Dude, Where Are My Cars: Spokane

As we mentioned a few weeks back, traffic in eastern Washington has been pretty stable for the past decade—suggesting that the flattening of traffic growth isn’t just a big-city phenomenon.

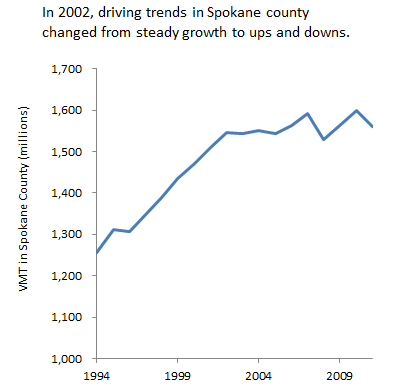
But the eastern Washington figures were dominated by Spokane—which isn’t a big city, but isn’t a small one either. So what’s going on with traffic volumes in Spokane? As the chart to the right shows, Spokane follows a trend that’s fairly similar to the state overall: steady growth through the early 2000s, followed by a bumpy plateau.

Read more

Dude, Where Are My Cars: I-405

OK, so we’ve already documented that total vehicle travel—as measured both by traffic volumes on specific segments of the roadway, and by total miles logged on the state highways—has remained roughly flat in much of Washington State for most of the past decade.  Yes, there have been ups and downs, but car travel simply isn’t growing the way it used to.

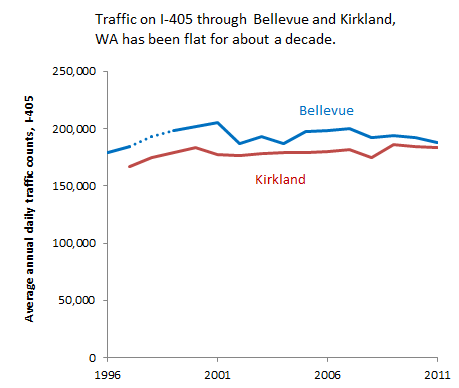
So at risk of beating a dead horse, here’s a chart of average daily traffic on I-405 through Kirkland and Bellevue, WA. And in case you were wondering…yep, traffic is flat!

Read more

Traffic Forecasting: A Blast from the Present

Oops, they did it again.

As we mentioned earlier in the week, way back in 1991 the Washington State Department of Transportation recommended that engineers forecast future traffic volumes by finding a recent period of steady traffic growth, and simply assuming that this growth would continue. Although that approach probably worked well enough back in 1991, it’s been failing the region badly for the last decade. Surely by now traffic engineers know better!

Or, perhaps not. Take, for example, the Oregon Department of Transportation (ODOT) “Analysis Procedures Manual,” first published in 2006 and most recently updated in 2011. It calls for almost the exact same procedure as was found in WSDOT’s 1991 manual: running linear regressions from past trends to forecast future traffic growth. For details, see Section 4.6, or just read this excerpt:

Read more

Traffic Forecasting: A Blast from the Past

Editor’s Note: Read the follow-up post here.

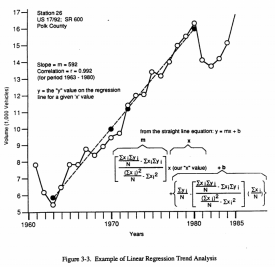
Looking through an old WSDOT traffic forecasting manual from 1991, Sightline intern Alex Broner came across this gem, illustrating the standard practices of the traffic engineering profession 20 years ago:

To calculate [traffic] growth, a simple linear regression technique is used to fit a straight line through historical traffic volumes on roads containing projects that do not add lanes. A straight line has proven to be the best fit for predicting future volumes for areas not subject to significant changes in population or employment growth. To confirm that linear growth should be used, the data are plotted on graph paper and examined for evidence of linear stability. A straight line is then fitted to the stable portion of the graph, and the slope is determined. [See pages 31-33.]

The chart to the right, taken from p. 32 of that report, illustrates the technique. (If you’re a traffic-math nerd, feel free to click to see a larger, more detailed image.)

Stripping away all of the math-speak, the meaning of the passage is clear: traffic volumes always grow. Even in places where population and job counts are stable, traffic volumes still grow. So the safest way to predict the future is to cherry-pick a reasonably stable period of growth in the recent past, and simply assume that traffic will continue to grow that fast in the future.

As simplistic as this technique seems now, it probably worked just fine for decades! Back when gas was cheap, median incomes were rising, and the baby boomers were moving towards their peak driving years, traffic volumes really did increase steadily. The only interruptions were temporary: the occasional recession or oil price spike.

Read more

Dude, Where Are My Cars: Eastern Washington

I’ve been following flat-lining traffic trends for a while now—and much of my focus has been in Cascadia’s big cities and major metro areas. But the trends are equally clear in smaller cities and rural areas.

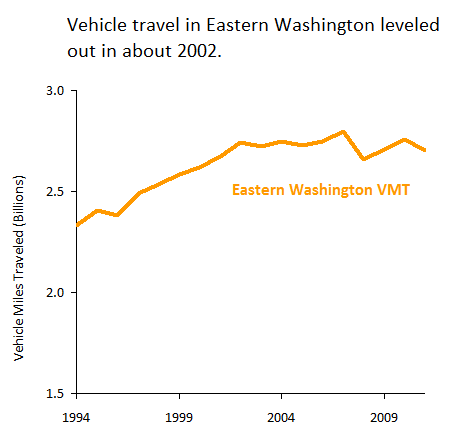
Take, for example, this chart of traffic in Eastern Washington, with the latest data from WSDOT’s Annual Traffic Report:

As you can see, traffic volumes in the eastern third of Washington rose fairly steadily through about 2002. Since then, they’ve been stuck on a bumpy plateau.

About 45 percent of the traffic in the chart above came from Spokane County, which is dominated by a mid-sized city and its suburbs. But what about the smaller counties? Is their traffic on the upswing?

Read more

Vehicle Travel, Rising and Falling

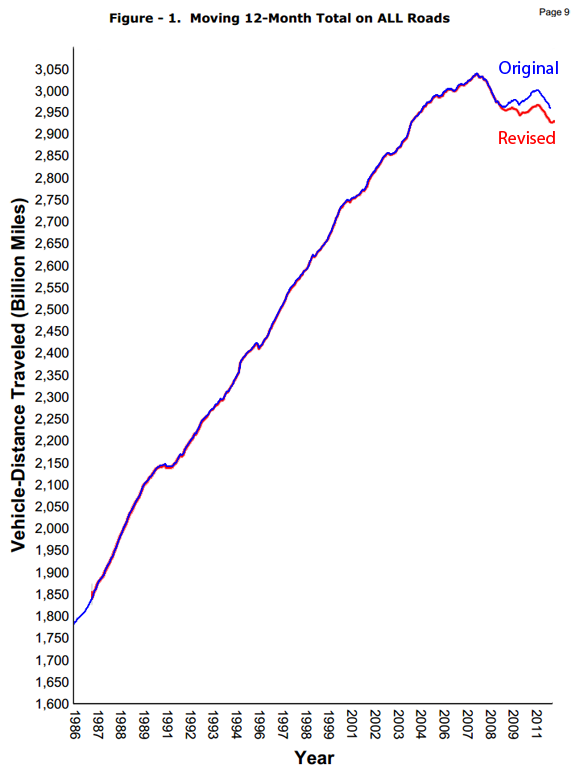
New data from the Federal Highway Administration suggests that U.S. vehicle travel rose in February—the third straight month of year-over-year increases. That comes as a bit of a surprise, given how high gas prices have been.

But there’s a hitch: last month the FHWA also revised its vehicle travel figures for past few years. The revisions weren’t huge…but they were all downward. The graph below, cobbled together from two different FHWA charts, shows the December vs. January estimates of historic vehicle travel in the U.S.

Young People Are Driving Less

Sheesh, kids these days.  In a brand new reportthe Frontier Group documents the sharp decline in driving among the under-30 set—and argues that those trends won’t reverse themselves any time soon.

I don’t think anybody really knows what the future holds for youth driving. But the Frontier Group has the recent trends nailed down pretty tight. Today’s young folks are less likely to own cars than their older siblings did. Many don’t even bother to get a driver’s license. Those who do drive are logging fewer miles on their cars. Economic shifts make it harder for young folks to afford to drive. Meanwhile, new mobile internet technologies and changing attitudes have reduced the car’s appeal, while boosting transit, biking, and walking. For anyone who wants to understand the changing face of car travel, the report’s definitely worth a read.

But youth are only part of the story of recent driving declines: demographic trends set in motion decades ago are taking a bite out of older Americans’ vehicle travel, too. Sure, folks under 40 have changed their driving habits far faster than us fogies. Yet there’s a monumental demographic shift underway among the older set: more and more baby boomers are entering the stage of life when driving ebbs.

Read more

How Income and Neighborhoods Affect Driving

From National Household Transportation Survey data, here are two charts showing how household demographics affect driving habits.

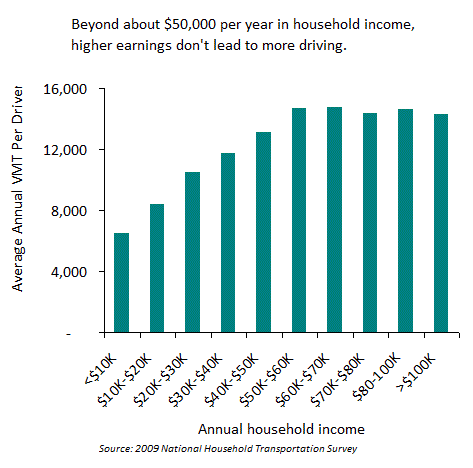
First, there’s income:

Clearly, as income rises, people drive more…but only up to a point!  As incomes rise past roughly the US average, driving flattens out. Which makes sense when you think about it: if your salary magically doubled, would you really want to spend more of your time behind the wheel?

This chart may offer a partial explanation for the declines in per capita vehicle travel we’ve been seeing in recent years. Over the past decade or so, incomes for middle class and poor folks have either been stagnant or declining; only the well-off have seen a significant benefit from “economic growth.” But if wealthy folks don’t drive more when they earn more, then today’s skewed version of “economic growth” might not do much to stimulate additional driving.

And here’s a second chart, looking at vehicle travel by residential density.

Read more