fbpx
Donate Newsletters

Oregon: Driving Downhill

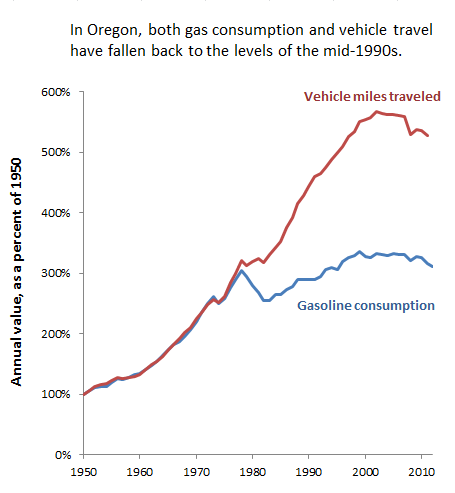
There’s a lot of history packed into this chart on Oregon’s vehicle trends: the seemingly relentless driving boom of the 1950s through 1990s; the decoupling of gasoline consumption from vehicle travel after the OPEC crisis and the economic downturn in the late 1970s; and, most recently, the peaking of both gasoline consumption and vehicle travel in the late 1990s and early 2000s, respectively.

Oregon vmt and gas2

But perhaps even more telling is the following chart, showing the same trends adjusted for population growth:

Read more

Where Are My Cars: Another Decline in Washington

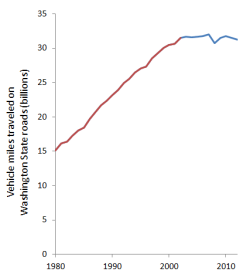
VMT on WA state roads

Vehicle travel on Washington’s state roads fell again last year.  It was a modest decline—just 0.8 percent—but as the chart to the right shows, it was a continuation of a full decade of essentially flat traffic. In fact, WSDOT estimates that total traffic on state roads was slightly lower in 2012 than it was in 2002.

There’s really not much to say about the trends that I haven’t said before. The flat-lining of traffic is due not to one single factor, but to many.

Driving Declined During the Recovery

Here’s a fantastic chart from the Atlanta Journal Constitution, based on work by Portland-based Economist Joe Cortright, showing the decline in driving since the end of the 2007-2009 recession (in red)—and how unusual that decline has been, compared with previous recessions.

We’ve covered all of this before, ad nauseum, but it still seems to surprise people: per capita driving has fallen considerably; total driving has been down or roughly flat; and you can’t just blame the recession. There’s something else much more fundamental going on—something that can’t be explained away by dips or blips in GDP.

Don’t Count On Toll Revenue Forecasts

From sunny Southern California, some gloomy news on highway tolls. Here’s the Orange County Register

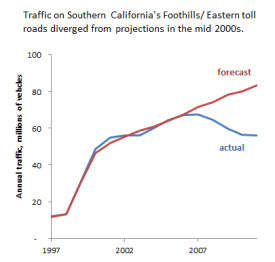
Orange County’s toll roads have slid farther and farther behind the confident projections of ridership and revenue on which they were built, prompting an unusual state review of their finances.

The roads were the first of their kind in California, a bet that drivers would be willing to pay to escape the grind of Southern California freeway traffic…but the bet has not paid off as well as operators expected.
Foothills

The bonds backing both projects have sunk to junk status—a sign that investors are worried about whether they’ll actually be paid back.

To be fair, one of the two toll projects was performing as expected up until 2006—when traffic started falling below projections. Revenue stayed up with projections for another couple of years, before it started to trail off as well.

But traffic on the other route lagged behind forecasts from the get-go. The toll route is generally free-flowing, but drivers prefer parallel, toll-free alternatives, even if they’re clogged with traffic.

Toll road failures are nothing new; in fact, they’re surprisingly common. But I thought that this case deserved a special mention, for two reasons.

Read more

Yet Another Crummy Traffic Forecast

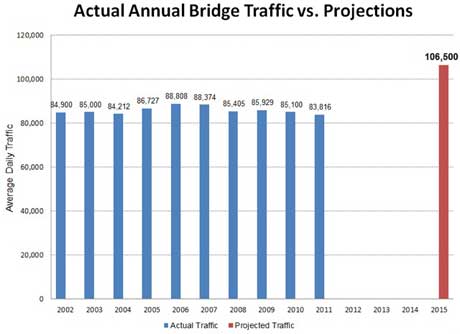
From a Willamette Live article, this chart virtually speaks for itself:

According to the article, the blue bars represent the combined traffic on two different bridges crossing the Willamette River in Salem, OR. The data show that traffic across the river has essentially flatlined for the last decade; there’s simply no evidence of growth. If anything, the numbers show a very slight decline, given that traffic reached a ten-year low in 2011.

Yet as recently as 2006, the state projected that traffic volumes would grow by 20 percent by 2015—as represented by the red line.

Read more

Where Are My Cars, My Good Chap?

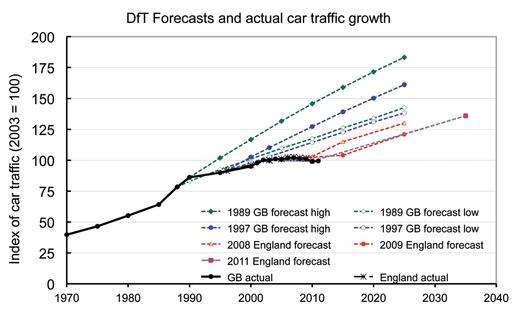
I’ve been a bit of a broken record about the fact that car traffic has been flat or declining in the Pacific Northwest. But it’s more than a Cascadian phenomenon. Gordon Price’s Price Tags blog spotlights this gem of a chart showing roughtly flat traffic trends (in black) and traffic growth forecasts (in various colors), put together by transportation researcher Phil Goodwin.

Looks familiar, eh what?

Dude, Where Are My Cars: Port Mann Bridge

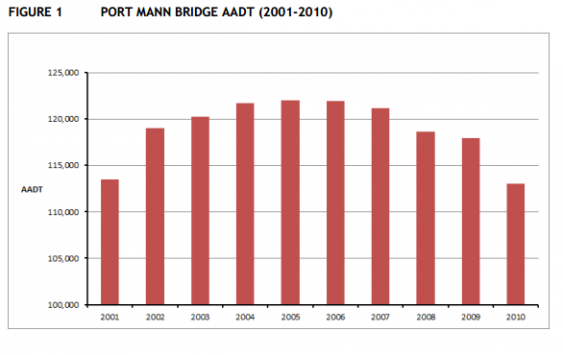
Unsurprisingly to regular readers of this blog, traffic on the Port Mann Bridge in Surrey, BC peaked in 2005, and then fell modestly but steadily through 2010.

That said, there’s no telling what this means for the future. A new, 10-lane Port Mann Bridge—certified by the Guiness Book as the widest bridge in the world—is nearing completion, and three lanes of the bridge have already been opened to traffic. A wider Port Mann crossing will likely be less congested than the current bridge, at least at first; and history has shown that free-flowing urban highways tend to attract new drivers. But it’s also tolled bridge—$1.50 each way for the first year, $3.00 and potentially rising with inflation thereafter—and tolling tends to reduce traffic volumes. Toss in some uncertainties around oil prices, vehicle efficiency, land use, and government policy, and there’s just no telling what the future traffic trajectory might be.

Read more

SR-520: A Case of Bad Forecasting?

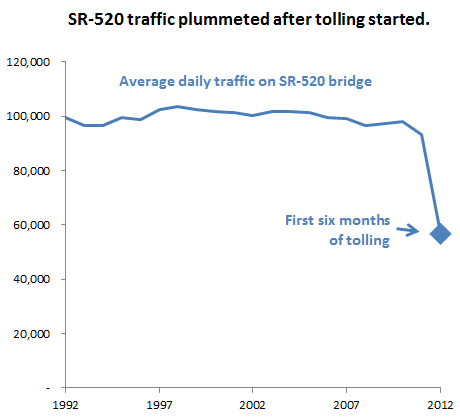
Here’s a blast from the past: WSDOT’S early forecasts, dating from 2002, for SR-520 traffic after tolling was scheduled to start. Depending on the tolling scenario, they predicted that the floating bridge would carry between 90,000 and 98,000 cars per day in the first year of tolling, down from a baseline of 118,000 cars per day with no tolling. (The report isn’t available online, so click for the full-sized scanned version of the chart.)

The reality for January through June: an average of 63,500 cars on weekdays, down from a baseline of 101,100 weekday cars the prior fall. When you include weekends as well, the trends are even more striking: