fbpx
Donate Newsletters

Recent Coal Export Trends: Q4 2011

Here’s data from the latest coal report from the US Energy Information Administration, taking us up through the end of 2011:

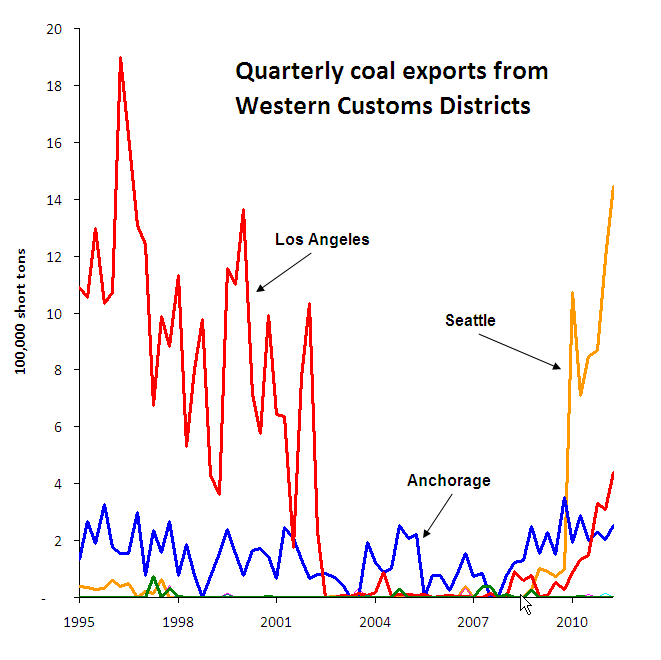
Chart created by Sightline using data from EIA’s Quarterly Coal Report


Driven by falling volumes leaving the Seattle Customs District, overall coal exports for the West declined during each of the last two quarters of 2011. The Seattle District shipped a bit less than 4.9 million short tons in 2011. Fourth quarter exports totaled less than 1 million, down 22 percent from the previous quarter. Coal shipments from the Los Angeles and Anchorage Customs Districts were up slightly in the fourth quarter.

Read more

Recent Coal Export Trends: Q3 2011

Here’s a look at the latest coal report from the US EIA, taking us up through the third quarter of 2011. In this chart, you see the past 15 years of quarterly data.
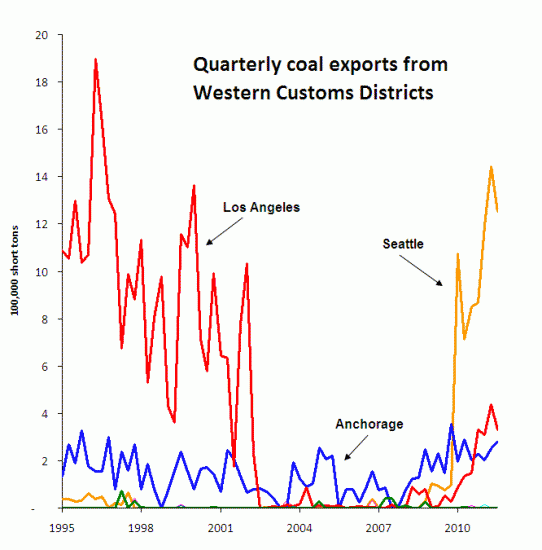
I’m showing Customs Districts here, not ports. The Port of Seattle does not move coal. But some coal does get exported out of the Seattle Customs District region by way of the rail crossing at Blaine, Washington. It is, by all accounts, Powder River Basin coal heading to BC’s Westshore Terminal for onward shipment to Asia.

Somewhat surprisingly, the third quarter of 2011 saw a decline in coal export volumes in both the Seattle and Los Angeles Customs Districts, as well as in the West overall. The Seattle District moved 1.25 million tons of coal in the third quarter, down 13 percent from the second quarter. Los Angeles District exports were down 25 percent. Right now, it looks like the Seattle District will ship just a bit more than 5 million tons in 2011. (Final 2011 numbers are due out in March, and I’ll report them here.)

It may look as though the West has been experiencing a coal export boom in 2011, but the volumes here are really nothing compared to what coal companies are planning. For context, here’s the same data plotted against the plans for the Cherry Point project alone:

Read more
Recent Coal Export Trends

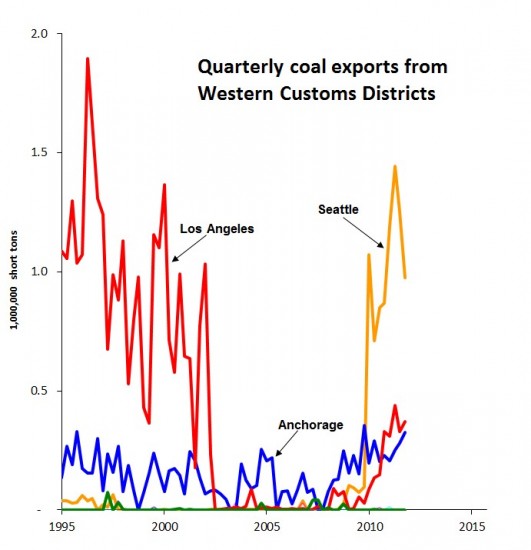
I’ve finally had a chance to absorb the US EIA’s latest quarterly coal report, which takes us up through the middle of 2011. As I’ve shown before (here and here) coal exports in the West have had a volatile history. In this chart, you can see the last 15 years of quarterly data, complete with upward spikes in the last few quarters.

Keep in mind that these are Customs Districts, not ports. Seattle itself doesn’t export any coal, but the Seattle Customs District does move some volume via the rail crossing at Blaine, Washington as the coal makes its way from the Powder River Basin to BC’s Westshore Terminal for onward shipment to Asia.

So what’s new in the data?  In the second quarter of 2011, about 1.4 million tons of coal were exported from the Seattle District. That was a 21 percent increase from the previous quarter, and a whopping 103 percent from the second quarter of 2010. Yet even at the current pace, 2011 coal exports from the Seattle District will only reach about 5.3 million tons — an order of magnitude smaller than what’s planned for Cherry Point.

For some perspective, here’s the same data plotted against the Cherry Point plans:

Read more

The Instability of Coal Exports II

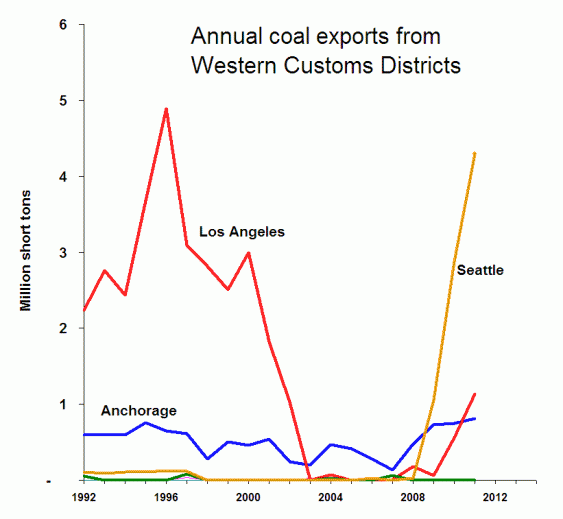
Following up on my last analysis of the instability of coal exports historically, here’s another look at the data. It’s confirmation that the Western US has had a rocky run in international coal markets. The following chart depicts annual export volumes by Customs District over the last two decades.


In the past, at least, coal has clearly been a volatile commodity. (The quarterly picture is even more ragged.)

Only three of the Western region’s nine customs districts have registered meaningful levels of coal exports since the early 1990s. The Los Angeles district’s trend line shows the spectacular implosion of the LAXT coal terminal. The Anchorage line shows the fairly modest but still unpredictable shipments from Seward. And the Seattle line shows the sudden rise in Powder River Basin coal making its way north to British Columbia’s Westshore Terminal for shipment to Asia.

Yet as volatile as the past has been, it’s nothing compared to what the future may hold.

Read more

The Instability of Coal Exports

When the Port of Vancouver, Washington rejected a recent coal export proposal the Port’s operations manager, Mike Schiller, explained that the economic fundamentals of coal are bad.

Coal is the most risky bulk mineral market,” is how Schiller put it.

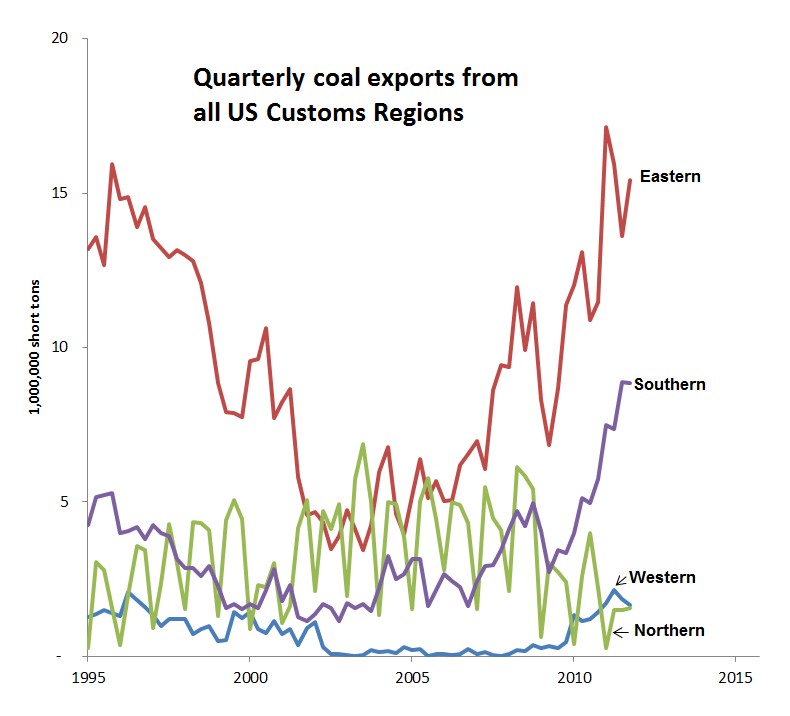
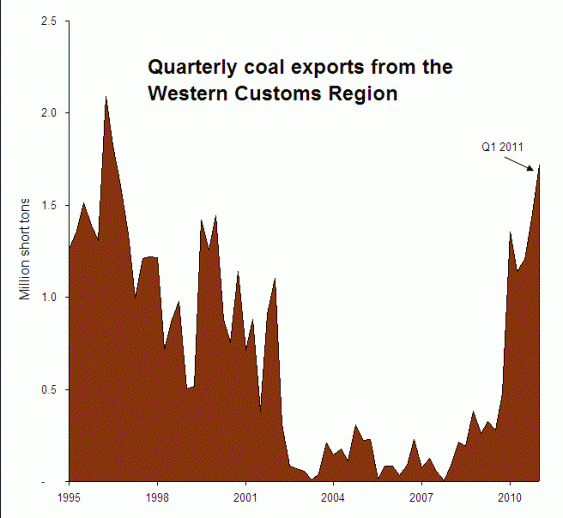
To find out what he meant, I did a little digging into the US Department of Energy’s quarterly coal export figures, which are kept online for each customs district in the country as far back to 1995. Here’s what the last 15 years has looked like for the region that covers the whole of the West Coast:

:

It’s not exactly the picture of stability. There’s a tremendous amount of volatility from quarter to quarter—suddenly doubling or tripling in volume, only to come crashing down just as quickly. The long-term trend is hardly more comforting.

Let’s take a closer look at the individual customs districts within the Western region:

Read more