fbpx
Donate Newsletters

Living Longer in British Columbia

Life expectancy reached a new high in both British Columbia and in Washington last year. That’s good news, since it means that the residents of both jurisdictions are living longer, healthier lives.

In one way of looking at things, the news comes as no surprise. Lifespans through much of the industrialized world have increased fairly steadily since the end of World War II, so record-breaking years are now more the rule than the exception.
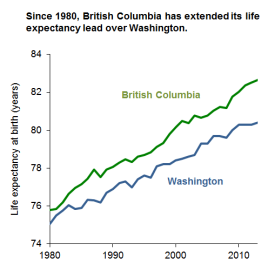
BC vs WA life expectancyBut what’s genuinely interesting is that life expectancy is rising much faster in some places than in others. As of 1980, for example, lifespans in Washington and British Columbia were nearly in a dead heat: 75.1 years for Washington, 75.8 for BC.  Yet since then, BC has pulled ahead. By 2013, lifespans in BC had reached 82.7 years, compared with just 80.4 years in Washington—a gap of 2.3 years, which is wider than at any point since Washington began annual reporting of life expectancy statistics.

Read more

The Northwest’s Native Residents

November is American Indian & Alaska Native Heritage Month, and that makes a good opportunity to take a quick look at the Northwest’s original residents. In North American terms, Cascadia is home to an unusually high concentration of people of Native descent.

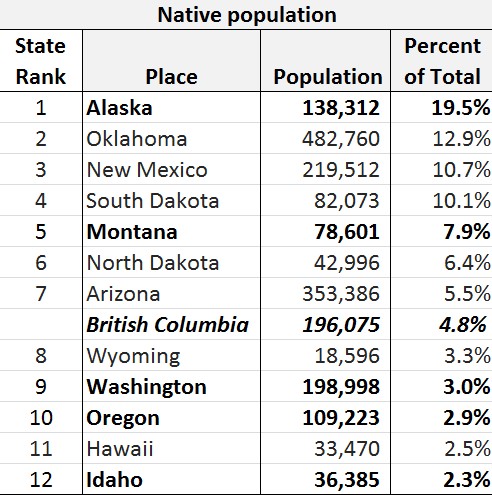
In fact, Northwest jurisdictions are home to more than three quarters of a million people of Native descent with nearly 200,000 in British Columbia and Washington each.

As a share of the population, no state has more Native Americans than Alaska where nearly 20 percent of residents self-identify as all or part Native. Montana ranks 5th nationally while Washington, Oregon, and Idaho occupy the 9th, 10th, and 12th spots, respectively. British Columbia’s population has a very similar profile to its US neighbors.

Let’s look more closely at the US portion of the Northwest, where localized population figures are easily available.

Read more

The Northwest’s Asian Indian Residents

Today is the beginning of Diwali—one of the most important events in the Hindu calendar—and that seems like a decent reason to take a look at a new facet of the Northwest’s demographic makeup.

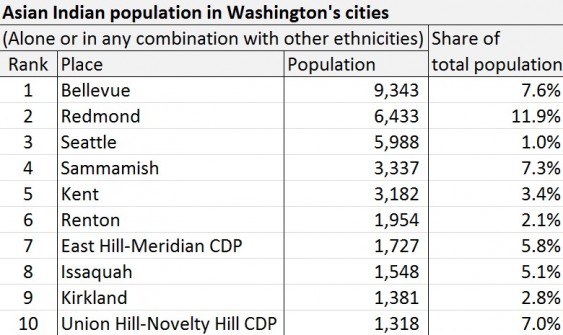
The world’s largest Hindu country, India, has added a substantial share of its people to some Northwest cities. Bellevue has far and away the highest number of Indian people in the state, though nearby Redmond claims the top spot on percentage basis.

Both have more in absolute numbers than the much bigger city of Seattle.

A quick word about the numbers. Theses figures come from the 2010 Census and refer to people who self-identify as either “Asian Indian alone” or “Asian Indian in combination with some other ethnicity” in official parlance.

Interestingly, every single one of Washington’s top cities for people of Indian descent is in King County and in particular, the high-tech cities of Seattle’s eastern suburbs—Bellevue, Redmond, Sammamish, Issaquah, Kirkland, and Union Hill-Novelty Hill—are home to a remarkable share of residents who identify as Indian. South King County rounds out the mix.

Read more

Race, Income, and Driving

The US is smack in the middle of two major demographic shifts: it’s aging, and at the same time it’s getting more racially and ethnically diverse. We’ve already discussed the effects of aging on driving: as the baby boomers move towards retirement they’ll drive less, and we can expect per capita vehicle travel to fall as a result.

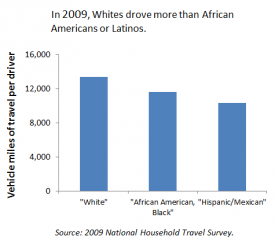
But how will diversity trends—particularly the increasing numbers of Latinos in the US—affect the nation’s driving patterns in years to come? This study, by researchers from the Southern California Association of Governments, argues that increasing diversity will alter driving habits every bit as profoundly as will generational shifts. And the 2009 National Household Travel Survey offers some support for that claim, since it shows that African Americans and Latinos drive much less than do non-Hispanic whites. (Click on the chart for a more legible version.)

But I’m not sure I buy it—not completely, at least. As far as I can tell, the California researchers looked narrowly at race and ethnicity, without factoring in the effects of income or neighborhoods on driving habits. But diving into the numbers a bit, it looks to me as if income inequality, rather than diversity, is the real trend to watch.

Read more

SeaTac’s Foreign-Born Boom

Last week, I wrote about the explosion in foreign-born residents in the Northwest. Next I thought it would be interesting to dig a little deeper into the demographics of one of Washington’s most diverse communities: SeaTac.

The South King County city is a mix of 1950s homes with manicured lawns, cul de sacs with a boat in every third driveway, and dense apartment buildings that serve as nuclei for refugees being resettled into this country and family members that follow. According to five-year American Community Survey estimates, 31 percent of its population is now foreign-born.

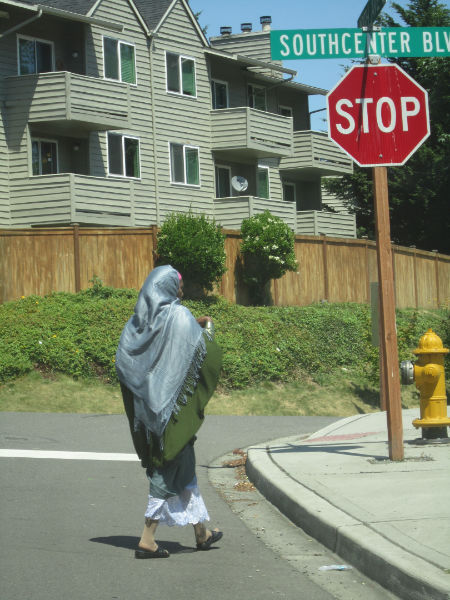
Photo: Jennifer Langston

SeaTac is also remarkable for the sheer diversity of countries that its residents hail from. Unlike some small cities that become magnets for immigrants from a particular country or region, SeaTac’s foreign-born residents are pretty evenly split from around the globe. The ACS breaks down the origins of SeaTac’s foreign born population this way: Europe 8.2%, Asia 24.9%, Africa 27.1%, Oceana 2.2%, Latin America 36.7%. The local library is a microcosm of that diversity: Computers are packed with people taking online English lessons, looking up nursing programs, checking Asian stocks, Facebooking with friends in Addis Ababa, and checking out Bollywood movies.

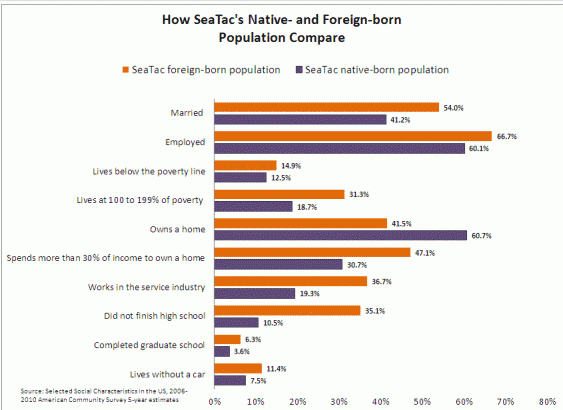
Although the US Census may not have the capacity to fully count and capture the complexity of immigrant and refugee populations, the limited data does offer some interesting comparisons between SeaTac’s native-born and foreign-born populations. Its estimates show that SeaTac’s foreign-born residents are more likely to be married, more likely to be employed, more likely to have left school before high school and more likely to have a graduate degree, and to make less money. Here are some of the highlights:

SeaTac chart

(To see a larger version of this chart, click here.)

Read more

The Northwest’s Global Appeal

Seattle and Portland still rank among the whitest cities in the country. If life doesn’t regularly take you to Tukwila or the Rainier Valley or Bethany or Hillsboro, it’s entirely possible to miss the region’s incredible growth in foreign-born residents.

Occasionally, though, the magnitude of these changes hits you. On my first day as a writing tutor in a local English Language Learning class, a boy handed me a very short story. His fifth-grade class of recent immigrants—Somali girls wearing headscarves, Hispanic kids chattering in Spanish and Mixtec, Burmese and Iraqi students—had been assigned to write something about their life. These aren’t his exact words, but this is how I recall the story that made me realize how ill equipped I was to offer any useful advice:

My mother asked if I was hungry. I said yes. She went to get food and fell down. I shook her. She was dead.

He didn’t offer many details at first, but I later gathered that he arrived as a refugee from Eritrea with what was left of his family.  It’s not an uncommon path to Washington State, which typically ranks among top 10 states for resettling refugees as they arrive in the US. That accounts for part of the state’s astonishing rise in foreign-born residents, as do recruitment practices at high-tech companies or research departments looking for international talent.

Read more

Sea Otters and Owyhees

Hawaii-philes may know that June 11 is Kamehameha Day. And that makes for a good excuse to recall the Northwest’s surprisingly strong connection to Hawaii, one that’s embedded in the region’s history and still reflected in its demographics.

Let’s start with the history. The connection began when Captain James Cook, in his third major voyage, became the first European to “discover” Hawaii—he called them the Sandwich Islands—in January 1778. Continuing east, he reached the Northwest coast in March where he named Oregon’s Cape Foulweather and Washington’s Cape Flattery before exploring the west coast of Vancouver Island and parts of Alaska.

Cook was killed on his return to Hawaii in 1779. Yet his voyage forged a bond between Hawaii and the Northwest when his crew discovered that sea otter pelts they had obtained on Vancouver Island had big time market potential.

Read more

Hawaiians and Pacific Islanders in the Northwest

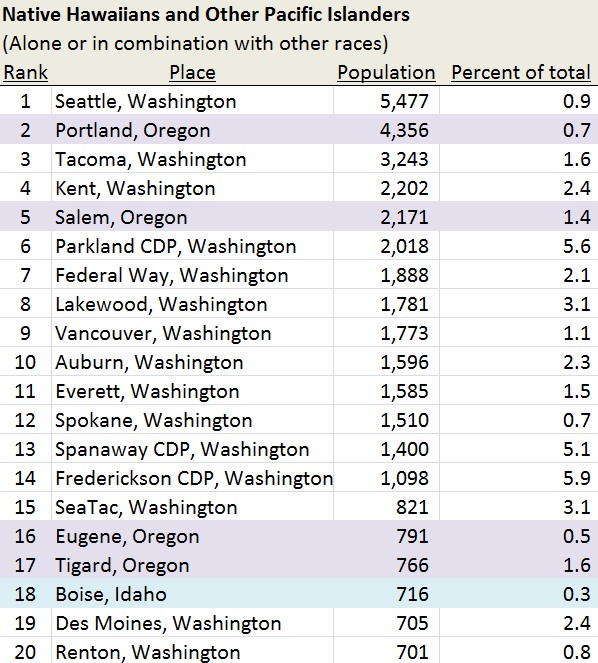
The Northwest has a surprisingly strong historical connection to Hawaii, which I’ll explore a bit next week. That connection is still reflected to a degree in the region’s demographics. Continuing my series on the evolving racial demographics in the Northwest, let’s take a look at Pacific Islanders who reside in Cascadia.

Washington is home to more people who self-identify as Native Hawaiian or Pacific Islander than any other state apart from Hawaii and California.

Not surprisingly then, the largest populations of Hawaiians and Pacific Islanders in the Northwest can be found in the central Puget Sound region. The cities that populate the stretch of territory from Everett through south Tacoma account for 13 of the top 20 spots in the region.

In Oregon, the big Willamette Valley cities of Portland, Salem, and Eugene boast the most Pacific Islanders with the Portland-area suburb of Tigard making a surprise appearance.

Read more

Light Rail and Racial Justice in Seattle

Anyone familiar with Seattle’s Rainier Valley knows it’s a place in transition.

Long one of the most racially diverse neighborhoods in the Northwest, it has for many decades struggled economically. In recent years, some areas of the valley such as Columbia City have gentrified rapidly even while nearby neighborhoods were rocked by the economic downturn, experiencing high rates of foreclosure and unemployment.

It was in that complicated geography that the Puget Sound’s first light rail line arrived, bringing with it both the promise of new investment and, for some, the threat of economic dislocation. To evaluate the changes Puget Sound Sage just published a new report: Transit Oriented Development That’s Healthy, Green, and Just.

I highly recommend it, in large part because the report invites a valuable equity perspective into a conversation that has not often focused on social justice. I also recommend it because it’s well-grounded in data and research.

Read more

Lane County’s Latino Residents

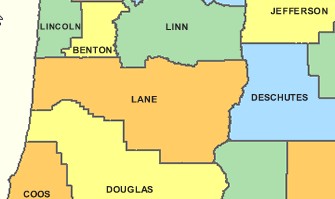
Sightline is working with University of Oregon Planning Professor Gerardo Sandoval to develop indicators of equity and sustainability for the Eugene-Springfield metro area, with special attention to the Latino community.

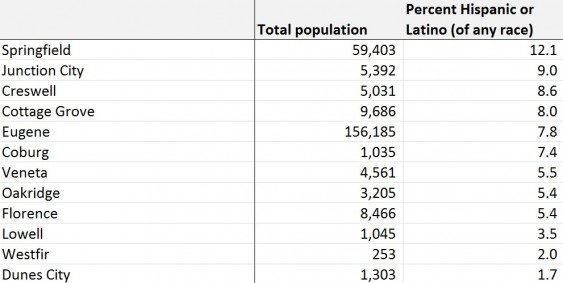
So, as part of our ongoing work on Cascadian demographics, I thought it worthwhile to see what recent Census numbers say about the distribution of Lane County’s Latino residents. (Last month, we conducted a state-by-state analysis of Latino residents in the Northwest.)

Here’s a rank-ordered view of the Lane County’s cities:

Read more