Search Results
-
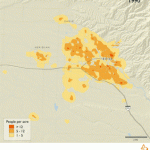
Boise-Area Population Density
Date Range: 1990-2000 Boise, Idaho, is the Northwest’s most sprawling metropolis.Read more » -
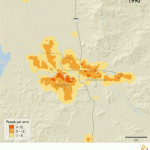
Eugene-Area Population Density
Date Range: 1990-2000 Though not nearly as densely populated as Victoria, BC, the Eugene, OR, area is slightly more compact then either of the regions other mid-size cities Spokane, WA, or Boise, ID.Read more » -
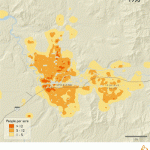
Spokane-Area Growth 1990-2000 (Animated Map)
Date Range: 1990-2000 The outskirts of Spokane, Washington, are dominated by low-density housing.Read more » -
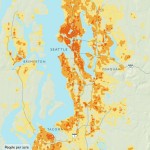
Seattle-Area Population Density Map
Date Range: 1990-2000 From 1990 to 2000, mapping of census data shows that the Seattle area became more compact.Read more » -
Fueling Up
An analysis of the Pacific Northwest’s gasoline use in the 1990s and its impact on the economy. Plus, why British Columbia is so much better at conserving fuel.Read more » -
This Place on Earth 2002 Excerpt
“This Place on Earth 2002” looks at the region’s progress in sustainability by assessing trends in ten key areas, from salmon health and spread of sprawl to income distribution and energy efficiency. This excerpt from the introduction explains the need for such alternatives to traditional gauges.Read more » -
This Place On Earth 2002
If we don’t measure what we value, we’ll end up valuing what we measure. This Place on Earth 2002 takes a close look at why society’s most-influential indicators—from the GDP to the Dow Jones—are failing us. It also presents a first effort at an alternative yardstick for the Northwest, by measuring how the region is doing in critical areas such as salmon health, sprawl, income inequality, and land use.Read more » -
Animated Map of Seattle and Vancouver, BC: A Decade of Growth
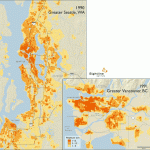
Date Range: 1990-2001 By 2000, 62 percent of Vancouver’s residents lived in compact communities, compared to 25 percent of Seattle’s residents.Read more » -
This Place on Earth 2001
A close look at why society’s most-influential indicators–from the GDP to the Dow Jones–are failing us. This Place on Earth 2002 also presents a first effort at an alternative yardstick for the Northwest, by measuring how the region is doing in critical areas such as salmon health, sprawl, income inequality, and land use.Read more »

