Search Results
-
City's Slicker
Every so often, we get criticized for being too fixated on fostering compact neighborhoods. “Density goes against what the housing market wants,” say some—ignoring the fact that most downtown housing developments around these parts get snapped up pretty quickly. Or, “Density is driving up the cost of middle-class housing,” which is simply backwards—density is a response to high housing prices, not a cause. So we think there are plenty of...Read more » -
Transportation and Climate Get Hitched
Update:Today’s Seattle P-I has my op-ed on this issue, and with a good headline too: “Transportation forever linked to climate change.” In the Seattle metro region, voters just sank an $18 billion transportation mega-proposal that would have built more than 180 lanes miles of highway and 50 miles of light rail. But so far, the mainstream press has missed one of the most important stories of the year. The real story isn’t...Read more » -
Growing Cooler
A couple of weeks ago I was in Vancouver, BC at a conference where it seemed like everyone was talking about a new book called Growing Cooler: The Evidence on Urban Development and Climate Change. Reviewing dozens of empirical studies, the book’s central argument is that urban form is inextricably linked to climate. Low density sprawl has been a principal contributor to North American climate emissisons. And by the same...Read more » -
Uh, Wow
I hate writing about political candidates, and especially presidential ones. But I’m going to do it anyway because I just finished reading Barack Obama’s newly released energy and climate plan. I’ve got to say: I’m stunned. It’s awesome. Among the highlights are a call for 80 percent reductions in emissions below 1990 levels by 2050, which would be accomplished by a cap and trade program. But this is the kicker:...Read more » -
Measure 37: Portland Region
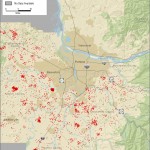
Portland has long been a national model for managing growth while preserving farms and open spaces near cities. A few months ago, we produced a map showing how Measure 37 threatens Portland’s legacy. Now, we’ve updated the map based on new data—and we’ve added a few touches to make it clearer. In this map, each red dot represents 10 new people based on active Measure 37 claims. Bigger, better maps...Read more » -
Measure 37: Hood River Farms
The Hood River Valley has been ground zero for Measure 37 claims. Yesterday, we examined how the valley’s prized farm country is threatened by an exurban population boom. Today, we take a different look at how Measure 37 jeopardizes Hood River farmland. In the map below, properties with active Measure 37 housing claims are showing in red. Yellow is land that’s zoned for agriculture. Here, you can see all the...Read more » -
Does Congestion Relief Equal Climate Relief?
Over the past week or so, there’s been a big to-do about greater Seattle’s transportation measure—affectionately known as the “RTID”—that’s set to appear on the November ballot. The measure would spend more than $17 billion on new roads, road maintenance, and rail transit, mostly through an increase in sales and vehicle taxes. To many people’s surprise, King County Executive Ron Sims (a former board chair of Sound Transit) came out...Read more » -
Measure 37: Hood River Region
Here’s a look at how Measure 37 sets the stage for nearly unrestrained population growth in the Hood River region’s exurban areas. In the map below, each red dot represents 10 new people based on active Measure 37 claims. Bigger and clearer versions are here. And here is an index of all the new Oregon Measure 37 maps. In the two counties shown here—Hood River and Wasco—there are 254 active claims...Read more » -
Measure 37: Willamette Valley
A few months ago, Sightline produced the first-ever map showing how Measure 37 claims could lead to an exurban population boom outside of Portland’s growth boundaries (see here). Now, we’ve expanded our analysis to include Oregon’s heartland: the Willamette Valley from Salem to Eugene. In the map below, each red dot represents 10 new people based on active Measure 37 claims. This image provides only a glimpse. Bigger and clearer versions...Read more » -
Map Series: New Residents in Rural Oregon From Measure 37 Claims
Maps depicting the potential population from Measure 37 claims in rural and exurban Oregon. Portland, Hood River Valley, and Willamette Valley.Read more »


