Last year I spent many of Cascadia’s long summer evenings at the spray park near my home in South Seattle’s Highland Park neighborhood. It was the highlight of my daughter’s day to toddle through the cool water and dry off by dangling from a swing. The park is just more than half a mile from our door, and most evenings, she made the journey in a stroller. Other families, however, arrived by car: the streets around the park were lined with parked vehicles. That isn’t surprising, given that single-family zoning covers almost 90 percent of the residential land, excluding parks and rights of way, within a half-mile in any direction of our neighborhood park.
This one-trick zoning type, which permits only one detached home per lot, severely constrains housing options within easy walking distance of the park. Most toddler legs can’t trek much more than a half-mile, and at the end of a long day, pushing a stroller up a steep Seattle hill sounds exhausting. So, for many families who haven’t been able to snag one of the houses surrounding our park, the daily choice becomes: hop in the car to get there? Or skip the hassle and stay home tonight?
If you want to live near green space in the Emerald City, single-family homes dominate your housing options.
The problem isn’t unique to my neighborhood park. The city of Seattle restricts building on a full two-thirds of the residential land (excluding parks and rights of way) within a half-mile—the rule of thumb for the distance most people are willing to walk to a park—of all city parks to just one building type: the detached, single-family home. Though these homes can legally have one accessory dwelling unit (ADU), like a backyard cottage or granny flat, fewer than 1 percent do as a result of the city’s overly strict ADU permitting process. Zoning is even more restrictive around parks that are one acre or larger: the city has zoned over 70 percent of residential land surrounding these parks single-family. And the problem is most egregious around many of the city’s best-loved parks: those with natural, undeveloped areas showing off the region’s ecological splendor. This pattern forces many Seattleites to rely on cars to access nature. What’s more, the unequal accessibility—favoring those wealthy enough to afford the homes with easy access to the city’s natural spaces—falls heaviest on people of color, renters, and households with annual incomes below the city average.
The inflexible zoning surrounding city parks constrains housing supply and narrows housing choices, making many parks inaccessible by foot to almost all but those fortunate enough to live in the single-family homes nearby. In other words, if you want to live near large or natural area green space in the Emerald City, single-family homes dominate your housing options. At an average price tag of $719,000, that is not a possibility for many Seattleites.
Where to put more parks? Wrong question…
Although it’s difficult to establish new parks in a city as built-up as Seattle, the city has another easy option. Rather than building more parks near people’s existing homes, it could allow more homes near existing parks. The city has before it several policy changes that would do just this.
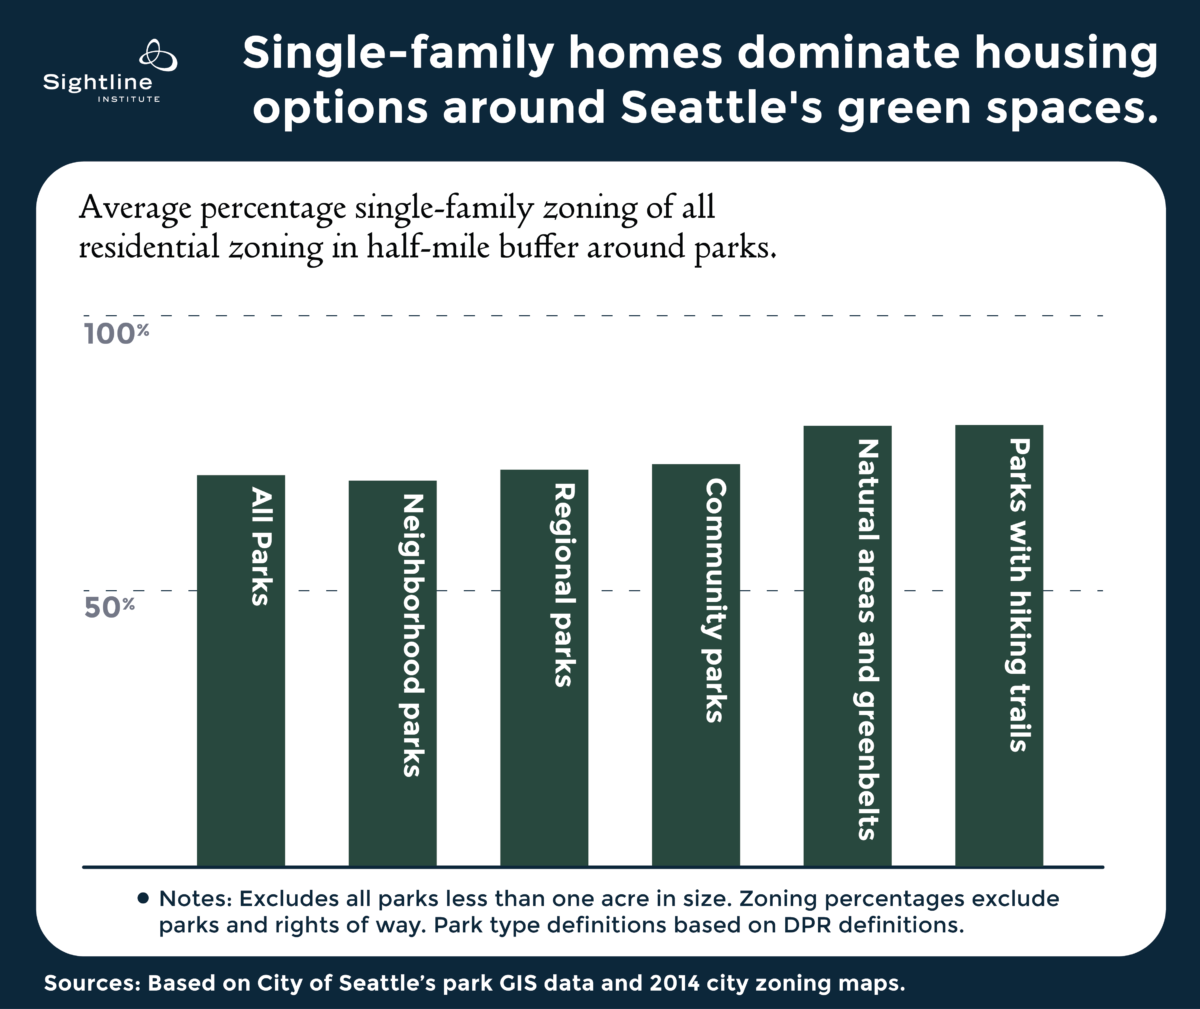
Zoning is even more restrictive around parks that are one acre or larger: the city has zoned over 70 percent of residential land surrounding these parks single-family.
The first would be to broaden the housing types permitted in single-family zones to include things such as small duplexes, triplexes, some rowhouses, and stacked flats. Each of these small multi-family units would be required to stay within the current allowed size limits for single-family homes but would produce more housing options on residential lots. Second, the city could reduce barriers to ADU construction, making it easier for homeowners to build additional housing units on their lots, such as backyard cottages, mother-in-law suites, and basement apartments. Finally, additional upzones may be justified in some areas, permitting low-rise buildings within park walksheds and creating more room for people to access the city’s gems.
Together these policies could produce a broader range of housing choices within easy walking distance of parks, providing Seattleites a greater range of price points and housing styles to suit their diverse lifestyles and stages, and ensure that more residents have an opportunity to easily enjoy the city’s green spaces.
A return to greener times
This proposed broadening of building types in the city’s single-family zones has historic precedent. Many of today’s single-family zones include multi-family units of exactly the types suggested in the current policy proposals—duplexes, triplexes, and some townhomes and stacked flats. These multi-unit homes in the city’s single-family zones are left over from the city’s more flexible zoning past.
In December, Sightline published a map tracking all multi-family housing in Seattle’s single-family zones. These housing types include ‘plexes—duplexes, triplexes, 4-plexes—townhomes, and ADUs. Since then, we’ve published articles exploring how Seattle’s more flexible zoning history led to the construction of most of these homes and how these homes help combat segregation in the city’s increasingly divided public school system.
In this article, Sightline publishes a new layer of the map to show how these homes increase access to Seattle’s public green spaces of one acre or more, from parks to playgrounds, playfields to gardens, greenbelts to trails. By examining how these housing options already increase green space access in the Emerald City, we can glimpse what expanding this flexibility might do for the future of Cascadia’s largest city.
Click here to see full size map.
The current state of parks and ‘plexes
Currently, ‘plexes in Seattle’s single-family zones add more than 4,000 homes within a half-mile of all city parks larger than one acre. ADUs contribute another nearly 1,000 homes in easy walking distance to these same city parks.
Looking again at my neighborhood park, Highland Park Playground, there are 8 ADUs within a half-mile of the park, as well as 16 other “non-conforming” units: 9 duplexes and 7 4-plexes. Together these units provide 38 additional homes with great park access. These houses are most likely rental options, and could house young families, students, or aging parents. Between them, the extra homes give about 80 people access to the park who otherwise would have had to compete for housing elsewhere in the city—that’s 80 more people who can walk to the park with me this summer.

In this image, light gray areas represent single-family zoning, and dark gray areas are multi-family, low-rise zones. My neighborhood park, Highland Park Playground, is shown in bright green, and the orange circle marks a half-mile buffer around the park, outlining the area in standard walking distance to the park. The eight orange dots represent ADUs, the green polygons are duplexes, and yellow polygons are 4-plexes. Original Sightline Institute graphic, available under our free use policy.
What’s so great about green space?
What is counterintuitive is that, with all this demand, the city of Seattle has mandated almost the smallest amount of housing possible within walking distance of its parks: it has reserved most of the “walksheds” of city parks for single-family homes.
Research regarding the benefits of urban green spaces is robust and persuasive: parks may be the cheapest, quickest, and greenest way to improve human and community health, and all with almost no negative side effects. People who have easy and frequent access to urban green spaces have higher rates of college attendance and job satisfaction and lower rates of criminal behaviour, obesity, anxiety, and depression. Spending time in green spaces can reduce symptoms of ADHD and dementia, boost concentration, and improve high school student performance. People who live within a half-mile of a park report exercising more often and with greater intensity than those who live farther away. Parks are also good for communities. They cut air pollution, reduce crime rates, boost social cohesion among diverse ethnic groups, and help people feel more connected to their neighbors.
With all those benefits, it’s no surprise that a lot of people want to live near a park, and real estate prices surrounding parks reflect this value. Proximity to a park can raise housing prices by as much as 20 percent. What is counterintuitive is that, with all this demand, the city of Seattle has mandated almost the smallest amount of housing possible within walking distance of its parks: it has reserved most of the “walksheds” of city parks for single-family homes.
Unequal park access in Seattle
The Emerald City is just that: a city wrapped in a green coat, sewn in part from its world-class park system, which boasts more than 6,000 park acres across the city. While the majority of the city is within walking distance of at least one park (as the city’s 2017 walkability gap analysis shows), single-family zoning dominates the walksheds of the city’s largest parks and those with natural areas. This pattern leaves housing choices very limited for the almost 60 percent of Seattleites who don’t live in single-family homes.
As the graph below shows, park types with undeveloped, natural areas, including regional parks, natural area parks, and parks with hiking trails, are most enveloped by single-family zoning. Neighborhood and community parks, somewhat smaller park types that often contain playgrounds and grassy fields, are also largely enclosed by single-family zoning, though to a somewhat lesser degree.
Original Sightline Institute graphic, available under our free use policy.
There is also an imbalance in who has access to what type of park. Compared to the city’s population overall, renters, people of color, and people living on below-average incomes have less access to the city’s largest parks; parks with natural, undeveloped areas; and parks with hiking trails. These park types also offer some of the most benefit in terms of mental, physical, community, and environmental health.
Regional parks
Seattle Parks and Recreation calls some of its largest and most popular grounds “regional parks.” This park type averages 100 acres in size and often has both undeveloped, natural space and city landmarks and destinations. It includes some of the city’s best known and best loved spaces, including Alki Beach, Discovery Park, Lincoln Park, and Volunteer Park.
Unfortunately these parks also have some of the lowest accessibility, as they are surrounded by single-family zoning. The city has plastered single-family zoning on nearly three-quarters of the residential land within a half-mile of these parks (excluding park land and rights of way).
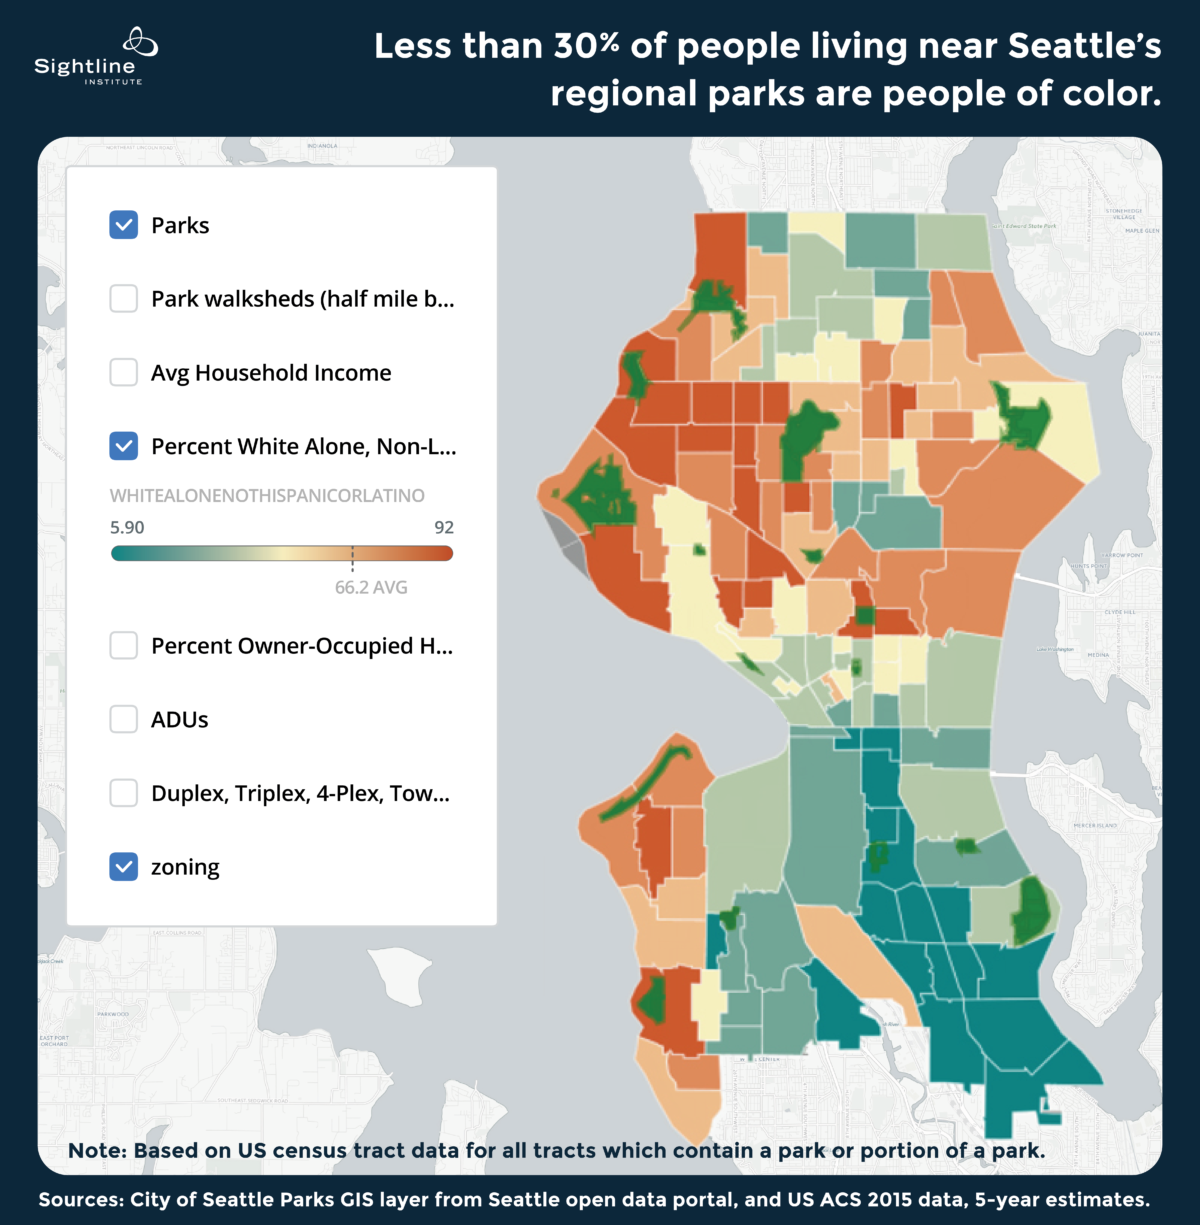
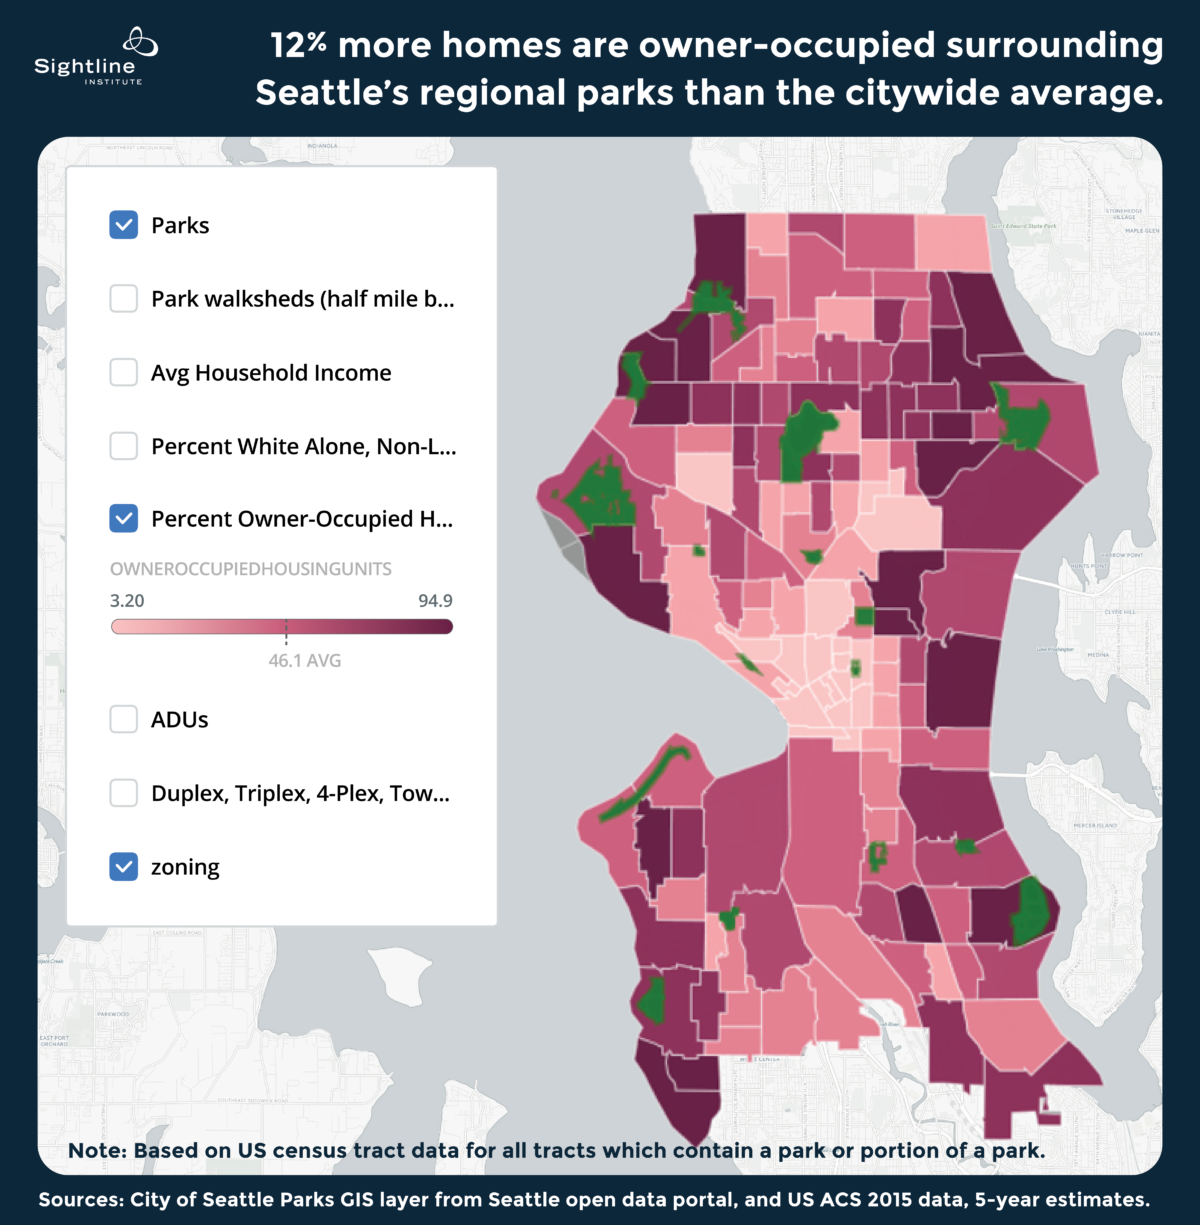
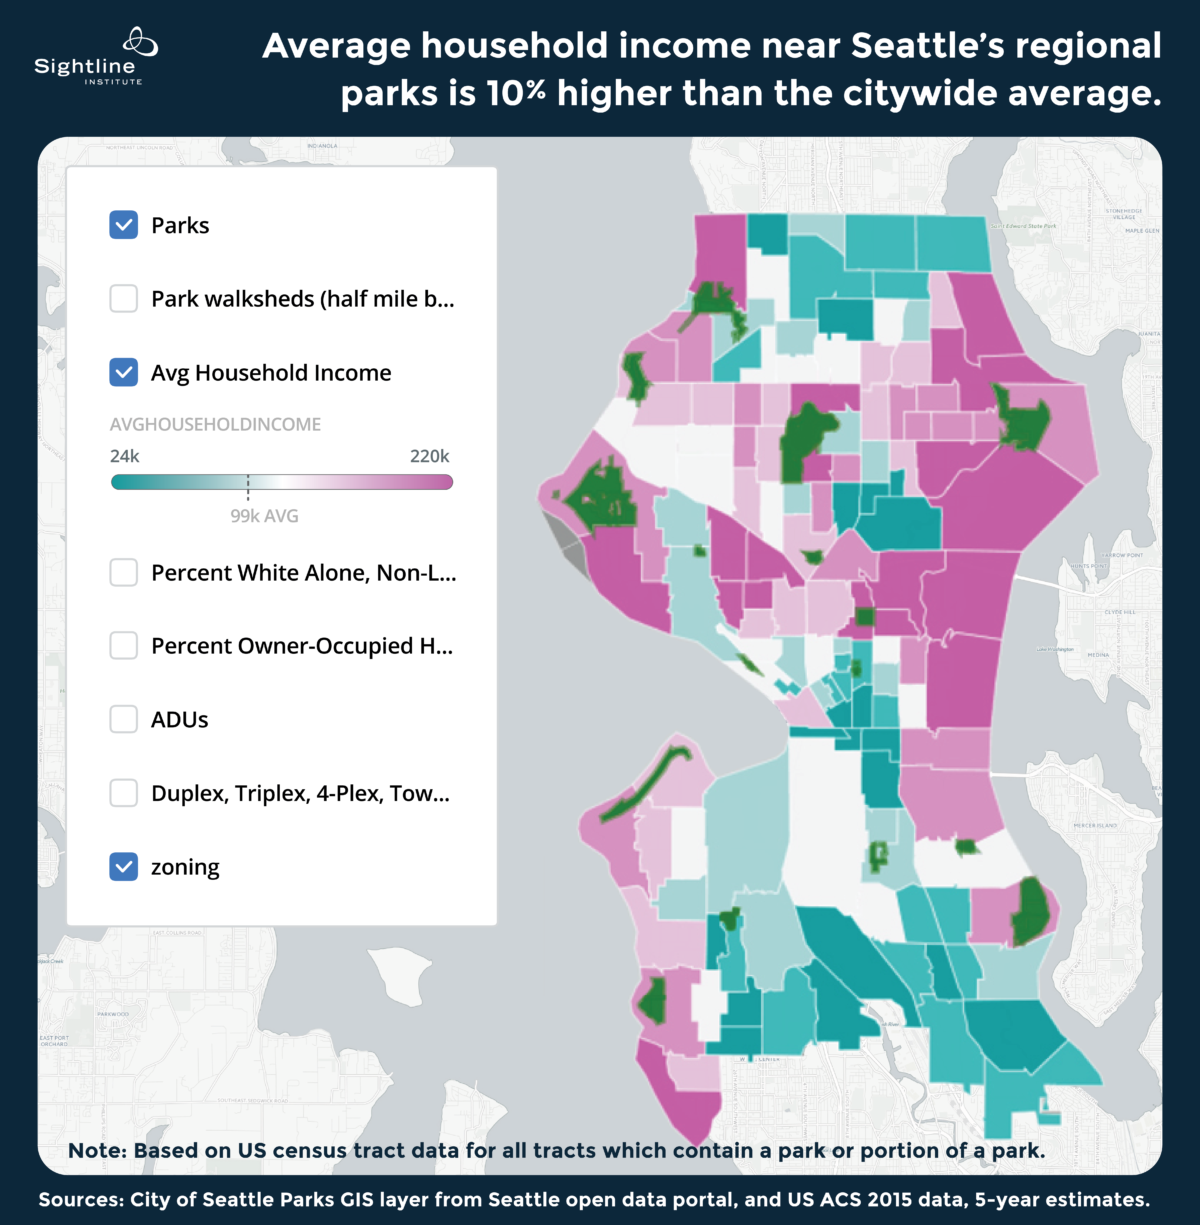
Homogenous zoning in walking distance of regional parks is a principal reason that people of color, renters, and people living on below-average household incomes have particularly low access to regional parks. Nearly three-quarters of the people living in census tracts surrounding the city’s regional parks report being White alone, non-Latino or Hispanic (for the rest of this article I’ll refer to this census category simply as ‘White’). That’s higher than the city average, in which 66 percent of people report being White. In addition, 52 percent of the homes in census tracts surrounding regional parks are owner-occupied, 12 percent higher than the Seattle average. Finally, average income for households surrounding regional parks is 10 percent higher than is typical in Seattle. A broader spectrum of housing choices around the city’s regional parks would permit a greater variety of Seattleites to live within easy walking distance of some of the city’s most popular parks.
Greenbelts and natural areas
Greenbelts and natural areas are parks that contain most of the undeveloped, natural areas in the city’s park system. These parks include Cheasty Greenspace, the Duwamish Head Greenbelt, and Interlaken Park.
This park type, of all the city’s park types, is also the most completely enveloped in single-family zoning. The city has outlawed all building save single-family homes and ADUs on fully 80 percent of the land within walking distance to these parks. As a result, households that aren’t well suited to a single-family home (think students, young couples, aging parents, and anyone else who doesn’t want to take on yard care) have much less access to the city’s natural areas.
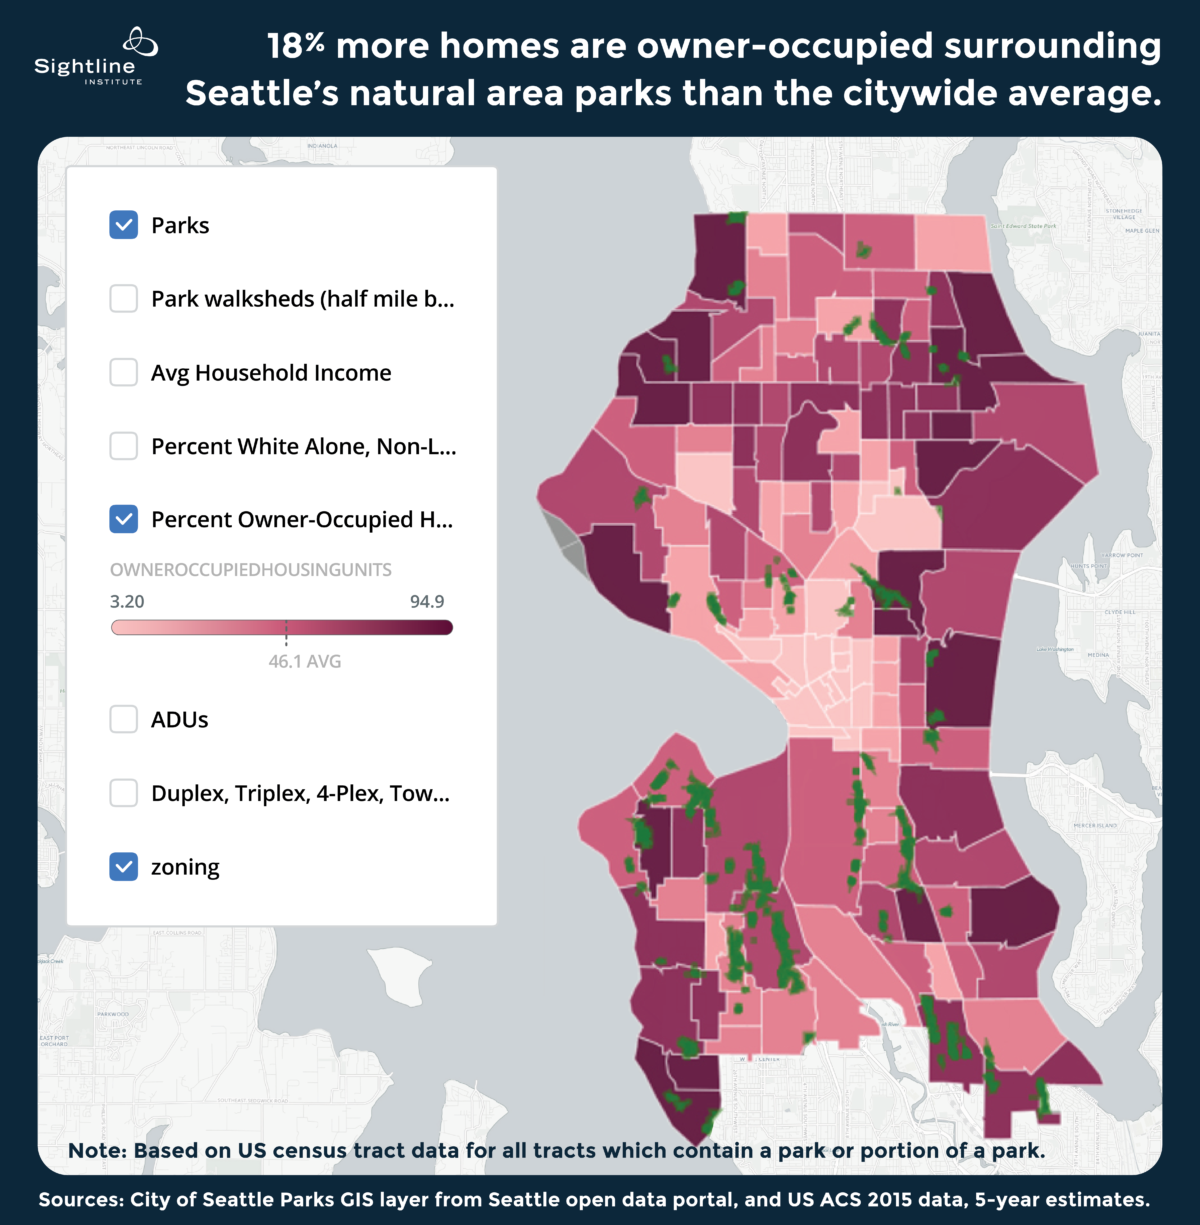
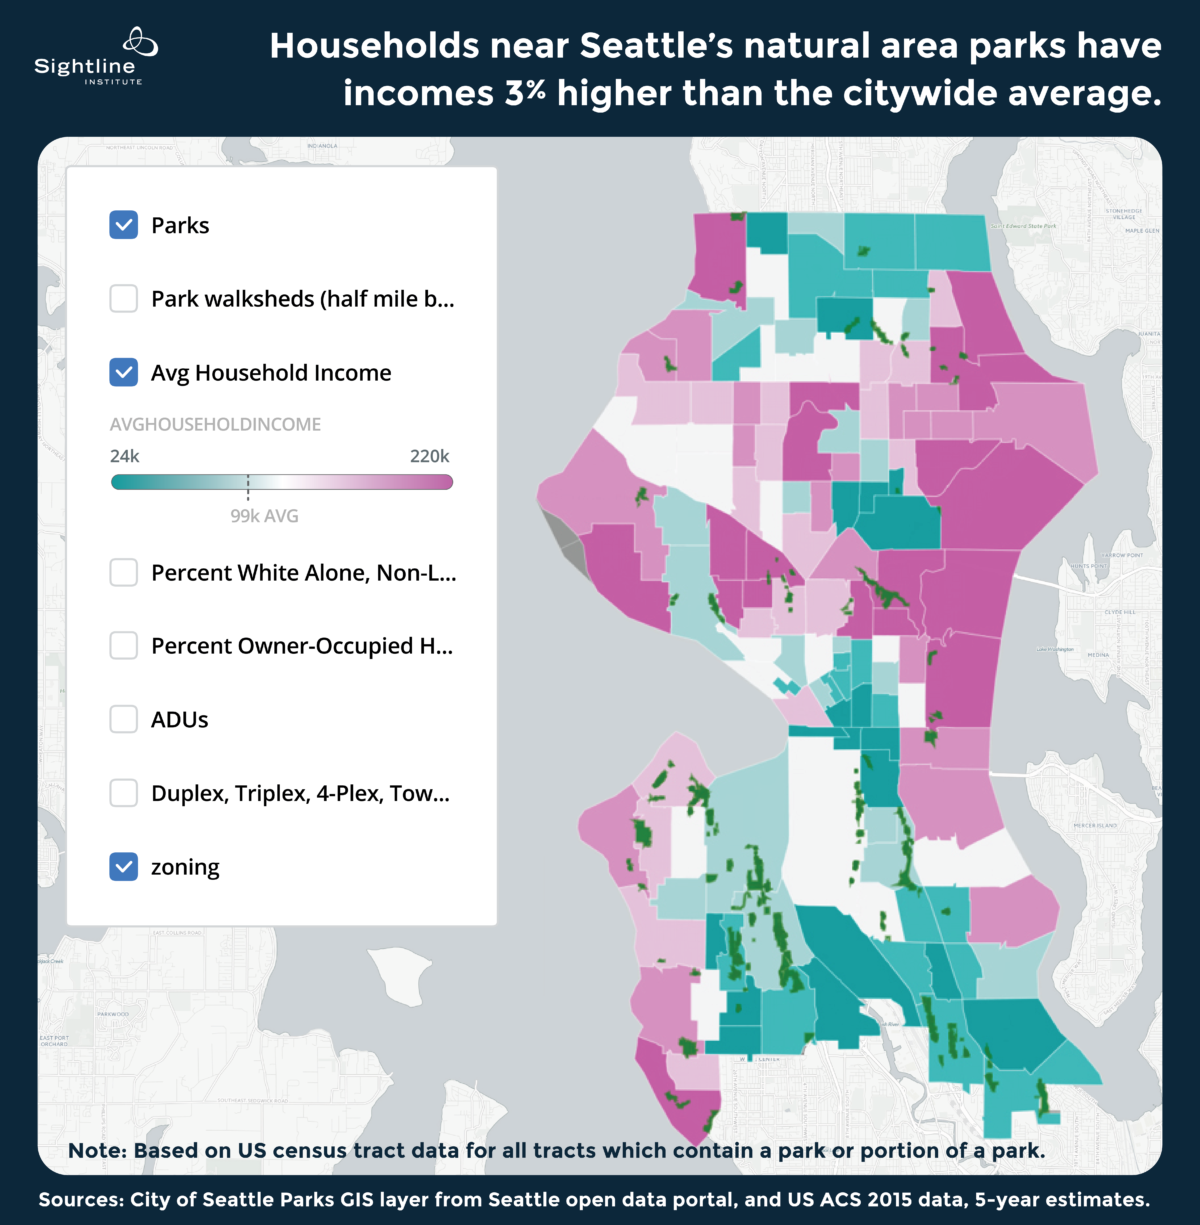
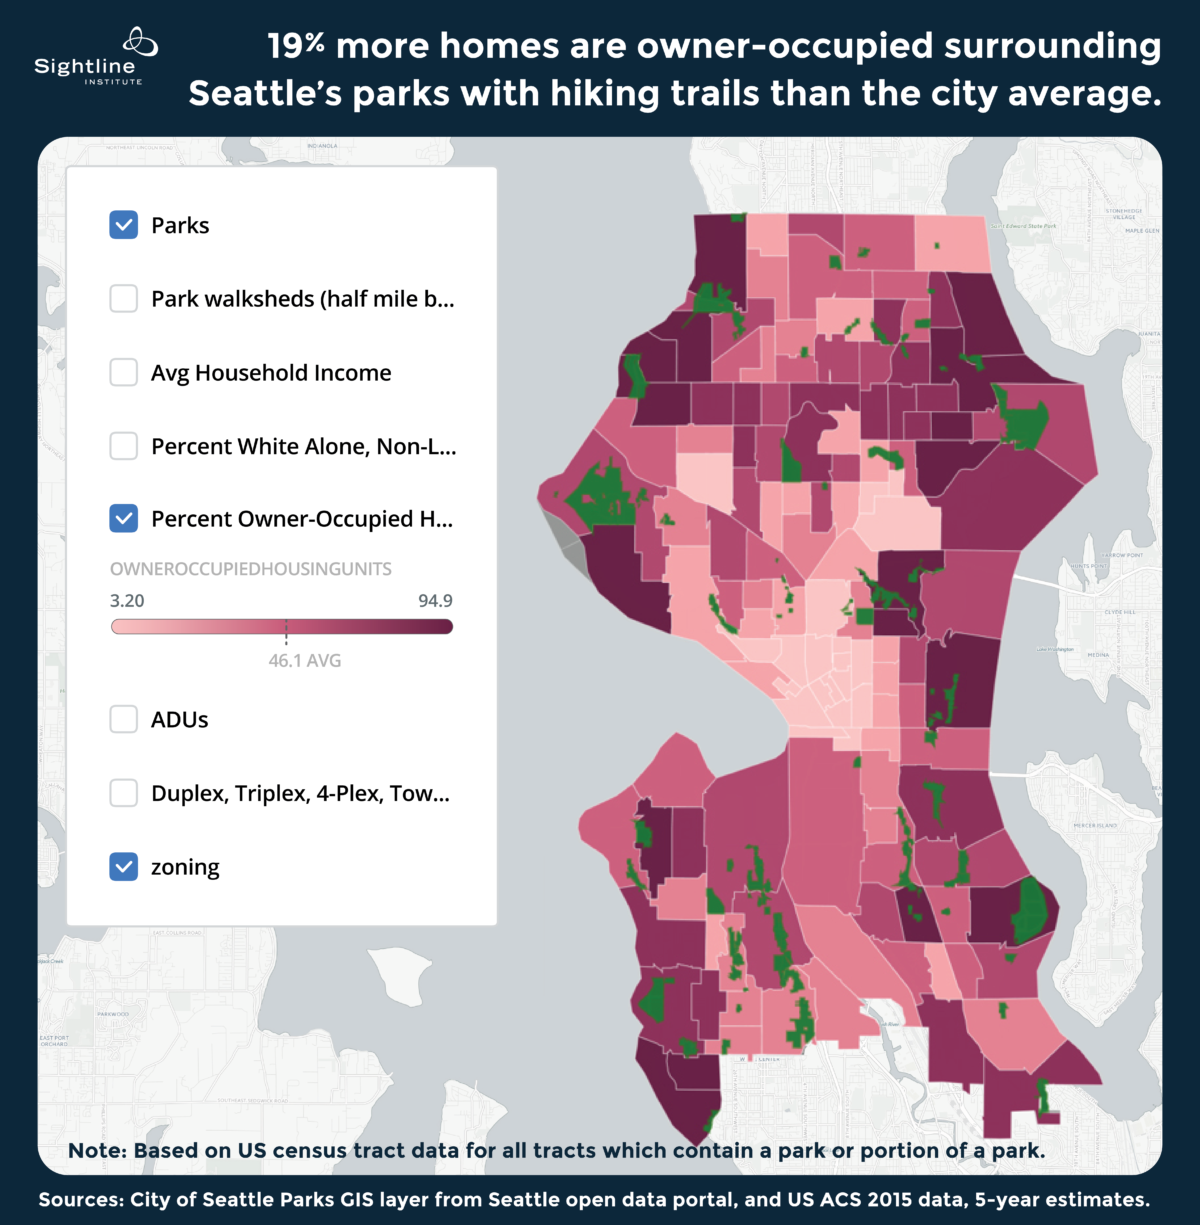
Renters have a particularly hard time accessing these parks, as 55 percent of the homes in these parks’ census tracts are owner-occupied, 18 percent more than the city average of owner-occupancy. Households surrounding these parks also have slightly higher incomes than typical in the city, averaging 3 percent higher than the average Seattle household income.
Hiking trails
For exercise, people are more likely to use parks with trails than parks without trails. A 2008 study of 28 park features found that parks with paved trails were 26 times more likely to be used for exercise than parks without trails, and even parks with unpaved trails were 7 times more likely to be sites of exercise than parks without trails.
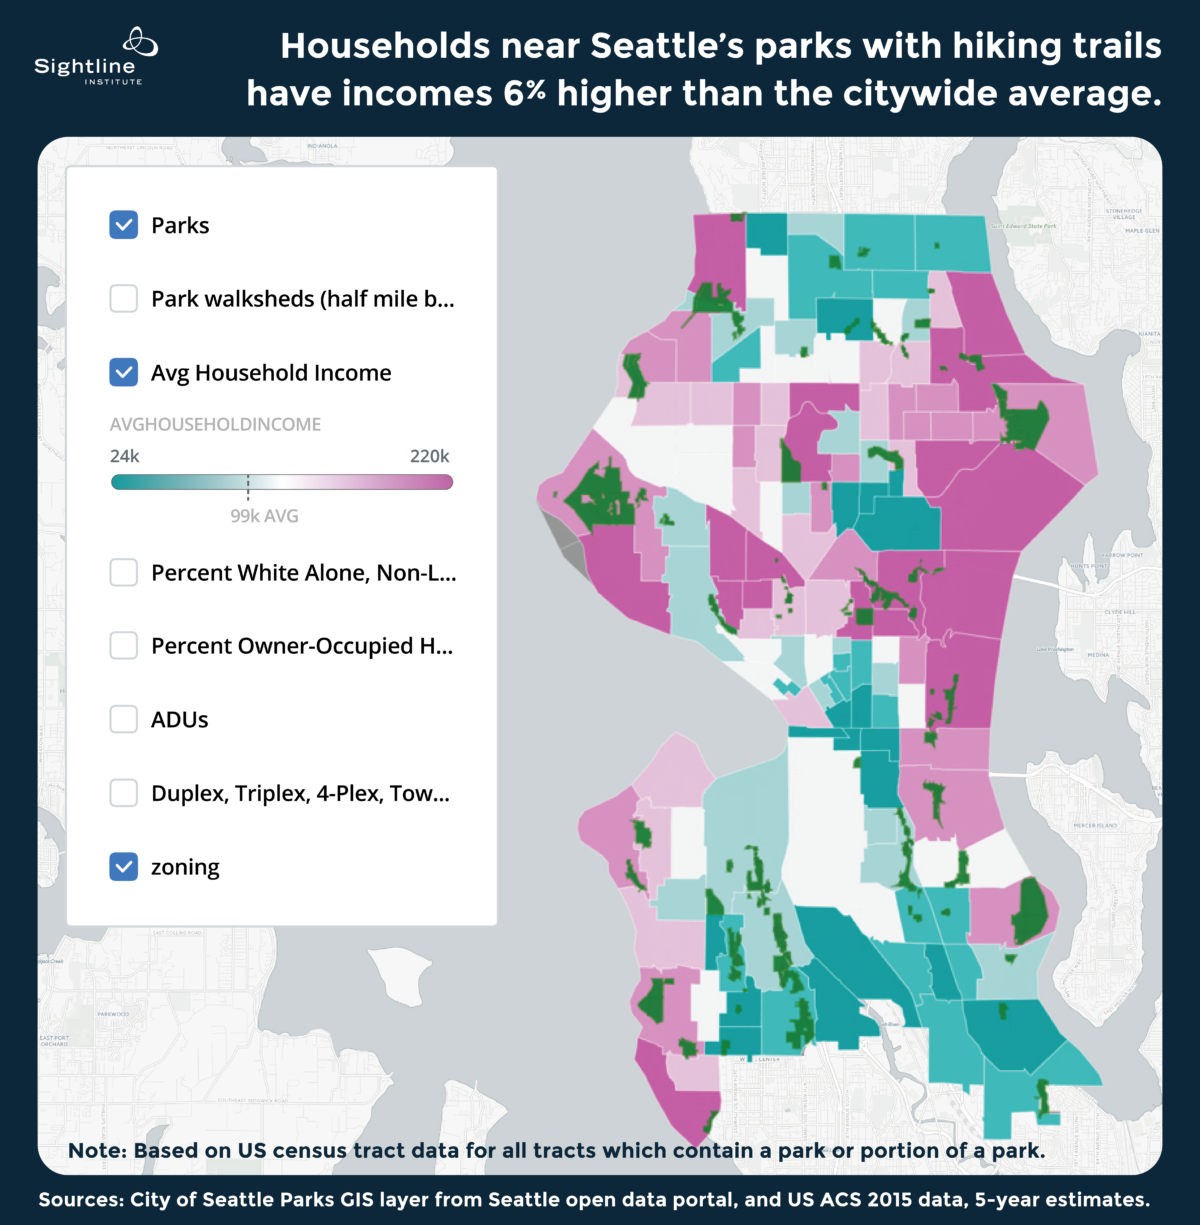
A whopping 80 percent of the residential land within easy walking distance to Seattle’s public hiking trails falls within single-family zones. These parks are particularly inaccessible to renters in Seattle and to households with incomes below the city average. Nearly 55 percent of homes in census tracts surrounding Seattle’s hiking parks are owner-occupied, and average household income in these census tracts is 6 percent higher than the city average.
How better zoning can improve park access
Although it’s difficult to bring parks to more people in a city as built-up as Seattle, the city can bring more people to parks by updating its zoning code. Multi-family units in single-family zones, including ‘plexes and ADUs, add nearly 2,000 additional homes within a half-mile of the city’s regional parks, over 4,000 homes within walking distance of natural area parks, and more than 2,500 homes with walking access to a park with a trail. Permitting low-rise buildings in some areas could add to this even more.
Take Schmitz Preserve Park, for example. City planners designate 87 percent of the residential land within a half-mile of this natural area park as single-family zoning, severely restricting the number of people who can live near the park. Furthermore, some 85 percent of homes in the park’s census tract are owner-occupied. Yet 44 duplexes, 2 triplexes, and a handful of 4-plexes surrounding this park add 66 additional homes within walkable distance of this green space. ADUs add another 19 homes with walking access to the park.

Schmitz Preserve Park, shown in green, is one of Seattle’s natural area parks. There are 19 ADUs (orange dots) within a half-mile of Schmitz preserve, and 52 other multi-family units in the single-family zones within a half-mile of the park. These units include 6 4-plexes (yellow polygons), 44 duplexes (green polygons), and 2 triplexes (dark blue polygons). Original Sightline Institute graphic, available under our free use policy.
As another example, Northacres Park is a 20-acre neighborhood park with wooded hiking trails in the Haller Lake neighborhood. Current city zoning mandates that only detached single-family homes may stand on 97 percent of the residential land within a half-mile of the park. But 19 ADUs, 9 duplexes, and a townhouse provide 30 additional homes within easy walking distance of Northacres. These homes house approximately 63 Seattleites, each of whom can take advantage of these trails for exercise, stress reduction, and a moment’s peace.

Multi-family housing in single-family zones surrounding Northacres Park provides an additional 30 housing units within easy walking distance of the park. These units include 19 ADUs, 9 duplexes, and a townhouse. Original Sightline Institute graphic, available under our free use policy.
Restrictive single-family zoning around parks keeps many people out. If the obstacles to getting to a park are high—too long a walk or having to drive—people will choose to stay home, making park visits special occasions rather than part of daily life. Seattleites have the opportunity to make their parks welcoming spaces, accessible for a greater diversity of city dwellers to regularly enjoy. Such a change to the zoning code would ensure that many more Seattle residents could share in the healing, health, fun, and growth that parks offer to people and communities.
As the sunlight stretches toward the longest days of the year this month, I look forward to heading back to my neighborhood park with my daughter (and now with her baby brother, too!). We are lucky that we can head out the door and be at a great park in less than 15 minutes. In years to come, I hope the same will be true for more Seattle families.
Special thanks to Matt Stevenson of CoreGIS for his help with some of the calculations in this article.
Appendix I: Navigating the map
For a primer on how to navigate the base layers of the multi-family housing in Seattle’s single-family zones map, see this previous article. The new parks-focused version includes five new layers, which I explore here.
The first new map layer shows in green all of Seattle’s city parks managed by the Seattle Department of Parks and Recreation (DPR) that are larger than one acre in size. We eliminated areas that lack accessible green spaces, including indoor community centers, golf courses, swimming pools, tennis courts, and the Seattle Aquarium. The top two widgets on the right pane allow you to search for a specific park by name or for a park type. The nine park types reflect DPR’s park classification system, which you can read more about on pages 32-33 of this city report.
Hovering your mouse over a park reveals a pop up window with the following information:
- the park’s name,
- park type,
- percent of single-family zoning of all residential zoning, excluding parks and rights of way, within the park’s walkshed,
- the number of multi-family units within the single-family zones in the park’s walkshed, including ‘plexes and townhomes, and
- the number of ADUs within the single-family zones in the park’s walkshed.
Clicking on the park reveals a larger pop-up window with some additional information, including park acreage and whether the park has a trail.
The second new layer shows park walksheds: half-mile buffers around each park. We selected the half-mile distance because the Trust for Public Land and the Center for City Park Excellence consider this the distance most people are willing to walk to get to a park. Since much of the city falls within a walkshed of at least one park, this layer doesn’t reveal much about housing and parks at the citywide level.
More important is the variety of parks. Playgrounds, hiking trails, and sports fields serve different purposes. We suggest turning this layer on only when you are looking at housing and zoning around a specific park or type of parks. For example, in the screenshot below, we’ve used the second widget on the right to filter the map to only show the city’s regional parks. Next we turned on the park buffers layer (in the layer selector box in the top left corner of the map). The resulting map shows orange rings representing a half mile distance from each of the city’s regional parks.

The map is filtered to show half-mile buffers around each of Seattle’s 19 regional parks. Original Sightline Institute graphic, available under our free use policy.
The third widget on the right-hand panel of the map allows you to display only those parks with hiking trails.
The next three map layers (shown in the top left layer selector window) contain the following demographic data for Seattle by census tract: average household income; percent White alone, non-Latino or Hispanic; and percent owner-occupied homes. Turning these layers on allows you to explore which parks are most and least accessible to households with annual incomes below the city average, people of color, and renters. You can turn these layers on by checking the respective boxes in the layer selector to the top left of the map.
For example, in the screenshot below, we’ve selected the average household income layer (notice that the box is checked next to this layer in the layer selector in the top left). Census tracts are now color-coded from turquoise to dark pink reflecting below- to above-average annual household income. There is also a legend in the layer selector showing what these colors represent and marking the average Seattle household income.

Original Sightline Institute graphic, available under our free use policy.
In this screenshot, we turned off the average household income layer and instead turned on the layer showing the percent of census tract population reporting to be White alone, non-Latino or Hispanic. Again, notice the checkbox and legend that appear in the layer selector window on the top left. In this case turquoise census tracts have the lowest percentage population reporting to be White, and dark pink census tracts have the highest percentage of White population.

Original Sightline Institute graphic, available under our free use policy.
Hovering over or clicking on a census tract reveals a pop-up window listing the census tract number and the demographic data of that tract, including average household income; percent White alone, non-Latino or Hispanic; and percent housing units that are owner-occupied.
By exploring these new map layers in combination with the multi-family unit in single-family zone layers (again, see this previous tutorial) you can see how city zoning impacts park accessibility across the Emerald City.
Appendix II: Methods
In all calculations in this article, single-family and other residential zoning categories exclude park land and rights of way. Residential zoning excludes industrial and major institution zoning.
To create these maps, we first downloaded the City of Seattle Parks GIS data from the city’s open data website. The dataset does not include reservoir parks and lidded reservoirs, such as the reservoir in Cal Anderson Park and Maple Leaf Reservoir Park, adjacent to Maple Leaf Playground. We eliminated public lands that did not have significant accessible green space, including parks that were less than one acre, and things like golf courses, tennis courts, community centers, swimming pools, the Seattle Aquarium, and the Woodland Park Zoo. We then added 2015 park type data to each remaining park based on city documents and some additional data sets acquired directly from city staff for the missing parks. We determined which Seattle parks have hiking trails based on this list from the city. The Active Living Research Program defines the difference between a trail and a path. Trails are meant to be sites of recreation, whereas paths are only built to connect two areas of a park. The city’s list of hiking trails specifically excludes boulevards and greenway parks, which include things like the Burke-Gilman trail. Including boulevards and greenways in the trail category would decrease the percentage of single-family zoning surrounding trail parks to 78 percent.
We then created half-mile buffers around all parks to determine areas within standard walking distance of each park. This is a somewhat crude method of measuring walking accessibility to a park. For example, some parks may only have entrances at certain points and though a household may be within a half mile of the park’s border, it could be a much longer walk to a park entrance. The City of Seattle conducted a more nuanced measure of park accessibility in it’s 2017 park gap analysis.
We then downloaded census tract GIS files from the city and added demographic data from the US census for each tract. Census tract outlines on the map follow US census tract definitions and extend slightly over the water bordering the city. Next we assigned census tract numbers to each park. For parks that spanned multiple census tracts, we included data from each tract a park touched in our calculations in this article. For example, the Burke-Gilman Trail is a Boulevard/Green Street park type and intersects with 10 unique census tracts. We included data from each of these 10 tracts in our calculation of the average percentage of detached, single-family homes in census tracts surrounding Boulevard/Green Street parks.
To calculate average household income for households surrounding a park type we calculated a weighted average using average household income per census tract and multiplying this by the number of households per tract.
The current average Seattle single-family home price is based on Zillow’s most recently published home value index data for April 2017.
For information on how we created the other layers in this map, such as the ADUs and other multi-family units in single-family zones, see this previous article.





JB
Why not also work on sane population targets, instead of demonizing people who want healthy elbow room to live on? Being able to pack more & more people into a finite space isn’t really something to be proud of. Poor Seattle was starting to crack when I left in 2003. While it now seems like a theme park for tech bros, it hasn’t stopped it’s careen to the bottom for working class people needed to run the infrastructure. Too many people in a finite space. Guess that’s our entire planet already…
GlennP
Great article explaining the benefits of parks for everybody, and not just for those that want to restrict so much of Seattle (near the big parks) for exclusionary “Single Family” zoning.
It is also important to think about allowing more Multi Family zoning, and missing middle, etc, near parks and walkable places, and not just thinking of more Multi Family in urban centers/villages or right next to transit.
I appreciate the more holistic perspective Sightline is helping to evangelize.
Jessie Attri
I am interested i bus access to parks especially for people to walk and explore new parts of the city. I had planned to use bus schedules and the book DISCOVERING SEATTLE’S PARKS by Linnea Westerlind 2017. Perhaps you have this information already??
Please let me know if you can help me enable residents of Horizon House enjoy using Metro to explore parks.
Ben Schonberger
Eli Spevak has been pounding this same drum in Portland, Oregon for years. http://www.orangesplot.net/2015/01/08/an-updated-proposal-for-residential-density-abutting-parks/
Cori
Correction, Highland Park is in West Seattle, not South Seattle.
Morgan
70% SF at park perimeters is far less above the mean of 65% SF than I’d expect, since I also expect that we have less total park perimeter in central areas.
Margaret Morales
Hi Morgan, Thanks for your comment. Sightline uses the most conservative measure of single-family zoning coverage in Seattle: 54% of Seattle is covered in SF zoning. That measure excludes both public rights of way and park land. So, in this article I found that 70% of walksheds around parks >1 acre are single family zoning (excluding parks and ROWs). That’s compared to 54% SF zoning citywide. It’s certainly a noticeable jump around the parks, though you are right – could always be even more dramatic!
(ps – I believe the 65% SF zoning coverage number you quote is one that excludes rights of way, but not park land.)
Tiarella
This is not about social justice or the environment. This is about money! Looking at the map, it is plain these are some of the most desirable properties in Seattle—many with views. This is just another way to open up prime lands for developers to swoop in and make tons of money. Imagine: a ring of luxury apartments walling off Schmitz Park, Ravenna Park, Lincoln Park. Nice for the developers, nice for the rich tenants, crappy for everyone else, including the wildlife and native plants who depend on these forest remnants.
Bryan K
Funny thing about Seattle zoning maps: if you look at then, you’d conclude they reflect a belief that people living in multi-family housing are incapable of walking 3 blocks perpendicular to an arterial to use transit, but walking that many or more blocks to get to a park counts for nothing at all.
Great empirical work.
KR
While this analysis is interesting, it’s too simplified of a solution to just call for more density around these parks/trails. The city needs to make an overt investment in parks and open space in the most park-poor communities in and around the city; it needs to ensure trails and trail networks touch every community in this city, making it easy for multi-modal transportation; it needs to improve the mass transit network so people can easily get to places like Discovery Park. The city’s HALA proposal attempts to get more housing units squeezed into places like Ballard and West Seattle, but it’s very short on the “livability” part of the agenda. As we increase that density in places that already feel too crowded, we need to incentivize better design, be creative like below-grade park and rides that have parks on top, we need to have community gathering places, tree-lined street and other greenways. This improves the community for all.
More ADUs are great, but blowing up the single-family zoning with multi-zoning everywhere is unrealistic, and would ultimately not serve the target population. Developers are now tearing down affordable older apartment buildings and maximizing profits with fancy multiplexes that do not serve anyone making less than 6 figures.
Phil
Interesting article and great food for thought. I have some reservations, particularly regarding natural areas and “naturalistic” parks. Natural areas are not intended to be heavy-use parks. The naturalistic parks in Seattle (that I have had experience with, mainly Carkeek) are seasonally heavily used; and at least for Carkeek, at peak usage, the parks are trashy, the trails eroded, and access difficult. (“Nobody goes there anymore – it’s too popular”). Our parks budget does not adequately maintain the parks for heavy usage; nor does there appear to be enough (heavy-usage) park space.
Both naturalistic parks and parks that are designed for heavier usage have a place; I would hate to see our naturalistic parks paved to allow heavier usage. My tendency would be to “bite the bullet” and increase both park area (via acquisition) and park funding, specifically targeting additional heavy-use parks in our denser areas. It’s not going to get any easier to add parks in the future, especially as we continue to densify. The argument of increasing density around parks now, and solving for the dense areas outside walksheds later, seems to be putting off the hard work for only temporary mitigation.
Great article! I’m sure my understanding and ideas are incomplete; but hopefully add some useful flavor to the conversation.
Steve Zemke
What is completely left out of this article is the advantage of single family homes also having yards and play space for kids and places to relax with trees around you without having to go to a park. Backyards provide privacy, garden space and family space. Building attached dwelling units removes yard space and trees. Little yard space exists in duplexes and triplexes as building space is a priority over green space. These are tradeoffs. You are making a passionate plea for more building which reduces tree canopy in neighborhoods which contributes to human health, nature on your property, stormwater reduction, slows traffic and removes air pollution among other things. Most people are not going to go to a park everyday but where they live is a daily event.