Vancouver is the first big city in North America to see 10 percent of commuters going by bicycle.
It only takes a few minutes talking to transport honchos in Portland, Seattle, and Vancouver, BC, to get a sense of the intense, if friendly, competition among their cities to be king of the cycling hill. But in many ways the three largest urban centers of Cascadia form one big, soggy petri dish of experimentation in bike infrastructure.
All three are North American leaders in prioritizing complete streets and bicycle transportation, though each has taken it own path. “Portland, Seattle, and Vancouver are each making major strides toward connected, all-ages bike networks,” said Linda Bailey, executive director of the National Association of City Transportation Officials.
“Each has made important design policy moves recently,” she added, “from committing to an all-ages-and-abilities network (Vancouver) to setting protected bike lanes as a design standard (Portland) to moving forward with major walk-bike-and-transit-friendly redesigns with protected bike lanes on key streets (Seattle).”
Vancouver is the first big city in North America to see 10 percent of commuters going by bicycle—several years ahead of its 2020 target for that milestone—according to the city’s annual transportation panel survey. Portland, nudging 8 percent, is the clear US leader in bike commuting. Runner-up Minneapolis is at 5 percent, while Seattle is at 4 percent, similar to San Francisco and Washington, DC. But keep your eye on Seattle: A newly developed five-year project plan should yield an interconnected bikeway network that could significantly change the equation.
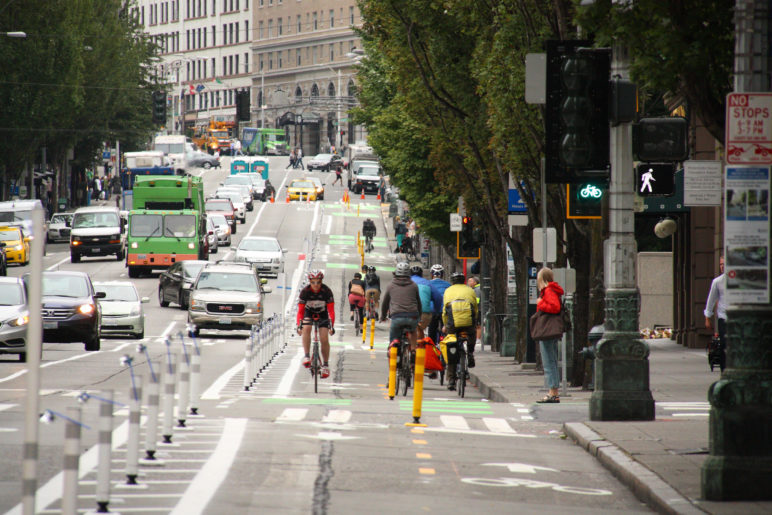
How much does safe-biking infrastructure matter in terms of luring commuters to the saddle? Well, consider that Vancouver nearly doubled the share of bike commuters from 4 percent in 2011, when a downtown network of barrier-separated bicycle lanes was just emerging, to reach 10 percent by 2015. It could be a coincidence, but folks in Vancouver seem convinced that having safe-feeling bikeways made commuters out of people who previously were “interested but concerned” would-be cyclists.
The table below shows each city’s miles of bikeways.
Portland has the most bike routes, but Vancouver the most protected lanes.
| Miles of bicycle infrastructure | Portland | Seattle | Vancouver, BC |
| Protected bike lanes | 6 | 14 | 16 |
| Striped bike lanes | 171 | 77 | 36 |
| Neighborhood greenways | 77 | 28 | 108 |
| Off-street trails | 85 | 53 | 33 |
| Total | 350 | 172 | 193 |
Source: City transportation departments of Portland, Seattle, and Vancouver, BC, as of April 14, 2017.
Overall, Portland has the most bike routes and Seattle the fewest miles overall. That said, most of Portland’s are just stripes of white paint, and Vancouver leads in protected bike lanes. For reference:
- Protected bike lanes (PBLs) are facilities physically separated from motor vehicle traffic and distinct from the sidewalk; they may be one-way or two-way and may be at street level or raised several inches above.
- Striped bike lanes are bike routes that are simply indicated on the road with a stripe of paint.
- Neighborhood greenways are residential streets with low traffic volumes. They are designed to slow vehicle speeds, giving people on foot or bike safe and pleasant travel priority.
The chart also reveals where each city has placed its emphasis. Vancouver in the 1990s and 2000s focused on creating bikeways by slowing and reducing traffic on neighborhood and side streets, then in 2010 began connecting downtown PBLs in earnest. Starting in the late 1990s, Portland went in big for striped bike lanes and off-street trails before diving whole-hog into bike boulevards, à la Vancouver, and then calmer, slower neighborhood greenways. Seattle has played a little “me, too!,” following Portland into neighborhood greenways while beginning work on a downtown network of protected bike lanes like Vancouver.
What the mileages don’t tell, of course, is how connected the networks are, how wide and fast the arterial streets are, or how civil the culture of driving and sharing the roads is in each of these locales. For those and other nuances, we take a closer look at each city.

Portland: Small but mighty—and on the move
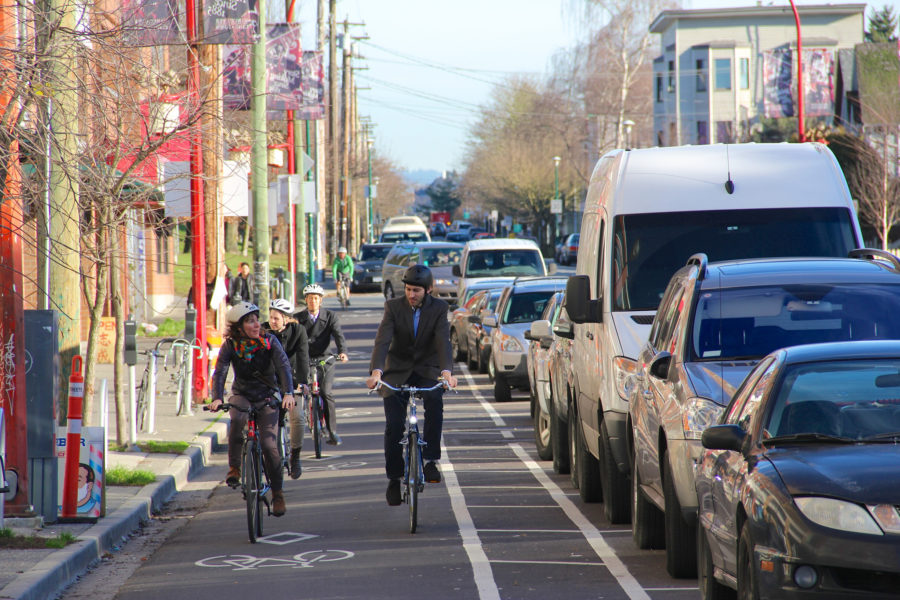
Portland began to earn its reputation as an urban cycling paradise in the late 1990s, following a bicycle master plan that called for more than 100 miles of striped bike lanes on arterial roads and dozens of “bike boulevards”—traffic-calmed streets with fewer than 1,000 cars a day, an idea pioneered in Vancouver. In 2009, Portland Bureau of Transportation (PBOT) took the concept even further, coining the term “neighborhood greenways” for all-ages, family-friendly streets where people on foot and bike rule. Using diverters and a variety of calming techniques, refuge islands, and roadway markings, the city began creating a network of streets with 500 or fewer cars a day, with speeds under 20 mph. For several years the city put $1 million a year into the program, until budgets got too tight. Still, the existing network, at 77 miles, covers a large swath of the city. (For more on this evolution, see this video.)
Though an early adopter of striped bike lanes and painted buffers, Portland has been late to the party with barrier-protected bike lanes. “We’ve totally been left behind on PBLs,” laments Jonathan Maus, editor of BikePortland.org. But that could be changing. In 2015, the director of PBOT, Leah Treat, issued a memo declaring that protected bike lanes should be the default design for every street where a bikeway is warranted. She reasoned that bicycle transportation was unlikely to meet its full potential or the city to reach its traffic safety goals—Vision Zero—without barrier-separated bikeways.
And in May 2016, voters approved a temporary 10-cent local gas tax, which will remove the remaining key barrier to acting on a long-planned network of PBLs: lack of money. The new tax funds the four-year Fixing Our Streets program, which designates a little more than half of its expected $64 million to projects for safer walking and biking.
Portland’s bike share program Biketown launched in July 2016 and signed up fully 3,000 one-year subscribers after just six months. The system is even more popular with visitors. In order to attract more local riders, city transportation officials are looking to speed up work on the downtown bike network in the hope that more central city denizens will feel comfortable grabbing bikes for their trips.
Unlike Seattle’s now-defunct Pronto—and most North American bike share systems—Biketown uses “smart bikes” that do not have to be returned to docks but can be locked at one of the 3,000 bike racks the city has placed in the service area over the last several years. Although an overlooked piece of bike “infrastructure,” that parking is paying huge dividends in expanding the ease of use of Biketown, and the GPS trackers in the bikes are delivering a wealth of data that the city can use to target future network improvements, said Margi Bradway, manager of PBOT’s active transportation and safety division.

Portland also stands out among Cascadia’s big cities for its bridges. Since the 1990s, many of its bridges have been remodeled for bike-friendliness. Then, in 2015, the city saw the opening of Tilikum Crossing, the first major bridge built to carry people on foot, bikes, and transit, but not in cars.
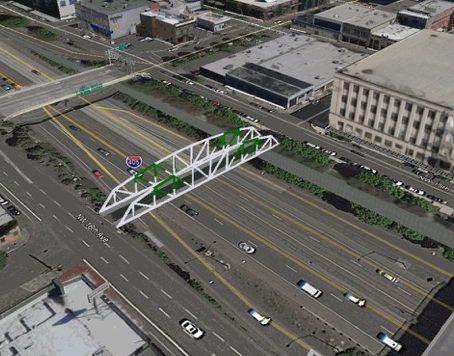
Now the city is preparing to build Flanders Crossing over I-405, a bicycle and pedestrian bridge that will connect the city’s densest residential neighborhood with downtown jobs and other destinations. Other plans call for construction of Sullivan’s Crossing over I-84, which would become part of a “Green Loop,” a proposed six-mile linear park and active transportation path around the core of the city.
Seattle: Suddenly pedaling faster
Seattle has arguably the most ambitious Bicycle Master Plan on the continent, and thanks to Move Seattle, a nearly $1 billion transportation levy that voters approved in November 2015, it even has the money to build a lot of it. So why have the city’s bicycle advocates been so glum in the last year-plus?
The 20-year plan calls for 100 miles of protected bike lanes, up from Seattle’s current 14, and nearly 250 miles of neighborhood greenways, up from 28. In campaigning for the Move Seattle levy, city officials vowed they would build half that network in the course of the nine-year levy. “Going into 2016 I was extremely optimistic,” said Tom Fucoloro, editor of Seattle Bike Blog. “There was a fresh voter mandate, new funding, and essentially shovel-ready plans. Instead, the city completely dropped the ball. They cut the scale back on bike infrastructure and then missed the goals of that plan in 2016.”
A major bone of contention was a decision to put the long-deferred downtown PBL network on hold again. City officials pointed to the need to create a master plan for the mind-bending number of major changes coming to the core of the city, including removal of the Alaskan Way Viaduct and the opening of Bertha’s replacement tunnel, the closing of a major bus tunnel for construction of an expanded convention center, and eventually the opening of Sound Transit’s East Link light rail.

But the proposed delay of safe bikeways only increased the angst of downtown commuters, who are dodging construction sites as the city undergoes its latest building boom. A 2016 commute survey found that as downtown added 45,000 jobs from 2010 to 2016, the share of people driving alone fell to 30 percent. While the share using transit soared, the proportion biking downtown held steady at 3 percent. “There are just not that many people willing to bike in heavy, mixed traffic with construction cones popping up every few blocks,” Fucoloro said.
But a newly released draft of Seattle’s five-year bicycle infrastructure construction plan, a plan for implementing the Bicycle Master Plan, is cause for renewed optimism, advocates say. Seattle Department of Transportation (SDOT) officials acknowledge that progress slipped in 2016—bad weather, inter-agency snafus, etc.—but they have a plan to get back on track and a renewed commitment to an interconnected bike network (and a little city council pressure, as well).
To be sure, the news in 2016 wasn’t all bad. Fulfilling a promise made in announcing the city’s Vision Zero goals, the city council lowered speed limits on residential streets to 20 mph and capped speeds on most arterials at 30 mph. To great acclaim, SDOT opened the Westlake protected bike lane, a long-awaited connection from north Seattle to downtown, via the flat route along the Lake Union waterfront. The department also completed the 1.7-mile Roosevelt protected bikeway. Those projects join a downtown PBL on 2nd Avenue and another on Broadway in Capitol Hill, but they don’t join each other. If all goes as planned, those corridors will get connected to one another by other safe bikeways in the next few years, as summarized in the video below.
[sightline-embed]
Vancouver: The cycling giant… for now
Let’s acknowledge that Vancouver gave itself a head start on bike-ability by fighting off urban freeways in the 1970s. The absence of spaghetti bowls of on- and off-ramps, concrete chasms to cross, and drivers speeding toward the highway gives it a mighty leg up on its American cousins in terms safety and comfort.
But let’s also recognize that the city is crisscrossed with six-lane arterials that do not cry out “come cycling,” as Dale Bracewell, Vancouver’s transportation planning manager, is quick to point out. “Our goal is to design for all ages and abilities, and our busy commercial streets did not meet that standard,” Bracewell said.
In the 1990s, the city began converting side streets into “bike boulevards” and pursued a “greenways” plan that tore out asphalt and concrete in some places to make park-like streets where biking and walking were comfortable. Today the city has 108 miles of such corridors. Bicycling grew to account for 4 percent of commute trips, easily surpassing most American cities at the time, but then stalled. “In 2008 we hit a bit of a plateau,” Bracewell said. “People needed to bike on the commercial high streets and destinations. In 2010, after the Olympics, we did our first downtown protected bike lane.” And they didn’t stop there.
In many cases, the city used plastic planters to cordon off some of its existing bike lanes. The key was to create a network of intersecting PBLs. Vancouver now is a continental leader in designing intersections where two PBLs meet, along with vehicle traffic. (Check out the intersections in this video of Burrard Bridge to Point Grey Road, along English Bay.) “We need not just projects but a network to get people where they want to go,” Bracewell said.
In 2012 the city adopted a Transportation 2040 plan that set a target of 50 percent of all trips being walk, bike, or transit by 2020, up from 40 percent. The city hit that target last year, with 7 percent of all trips being by bike. Furthermore, Vancouverites more than doubled their commuting by bike, to a continent-high 10 percent. By all accounts, the downtown network of protected bike lanes deserves much of the credit.
The next lap of Cascadian bike progress
Vancouver has thrown down the gauntlet to its Cascadian competitors. But with newly minted income and a hunger to lead, Portland seems poised to make a great leap forward on protected bike lanes, spurred by the added impetus of a Vision Zero pledge and a fledgling Biketown to nurture. Don’t be shocked, however, if the next lap goes to Seattle. Though the hare of this race at the moment, that millennial magnet has even more money flowing in over the next nine years, a desperate need for alternatives to sclerotic traffic in the face of rapid growth, and an advocacy community with political muscle.
With such strong, determined competitors, the next heat of the Tour de Cascadia should be a bracing ride.
David Goldberg has written about transportation and urban planning for more than 20 years for newspapers, magazines, and two national organizations, Transportation for American and Smart Growth America, where he coined the term “complete streets.”
[list_signup_button button_text=”Like what you|apos;re reading? Get our latest urbanism research right to your inbox.” form_title=”Housing Shortage Solutions” selected_lists='{“Housing Shortage Solutions”:”Housing Shortage Solutions”}’ align=”center”]


Comments are closed.