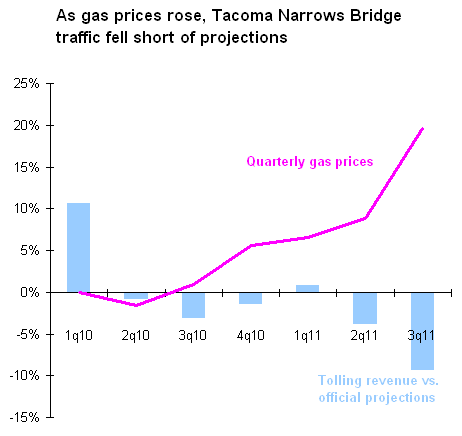
Interesting: tolling revenues on the Tacoma Narrows Bridge are starting to seriously lag behind the official projections.

Of course, the blue bars on the chart shows toll revenues, not traffic volumes. Unfortunately, the state hasn’t reported traffic counts in a while. And since revenues don’t always move in lock step with traffic counts (because tolling rates vary depending on vehicle size and payment method), I can only assume that traffic volumes are also falling short of projections.
Mostly, I attribute the shortfall to gas prices: when fuel costs shot up, tolling revenues started a year-over-year decline. But the projections themselves ought to shoulder part of the blame. The state forecast a 3.6 percent year-over-year increase in traffic volumes across the bridge in FY 2011. But statewide, traffic growth over the last decade has been just a fraction of that; and in the past year, the US Dept. of Transportation says that total traffic volumes in the state have actually slipped.
To me, this is just one more piece of evidence that the traffic models that we rely on to forecast our future transportation needs just aren’t cutting the mustard. They always seem to predict that traffic volumes are going to rise, fast, starting today—while the reality for the last decade has been a mixture of slow growth and unexpected dips.
Update 2:05: Fourth-quarter revenues could take a further hit after a glitch in the tolling system issued 26,000 questionable fines.
Sources: WSDOT and EIA. Hat tip to Joe Cortright.


Comments are closed.