Editor’s Note December 2022: Thinking about buying a Christmas tree? We’re bringing back this popular post weighing in on the great debate: pine vs. plastic, which tree is the better option for the planet? And if you decide to go for the ultimate sustainable option this year, check out our ten DIY trees that reuse and recycle.
Cascadia is a global center of Christmas tree farming, harvesting approximately nine million trees per year.
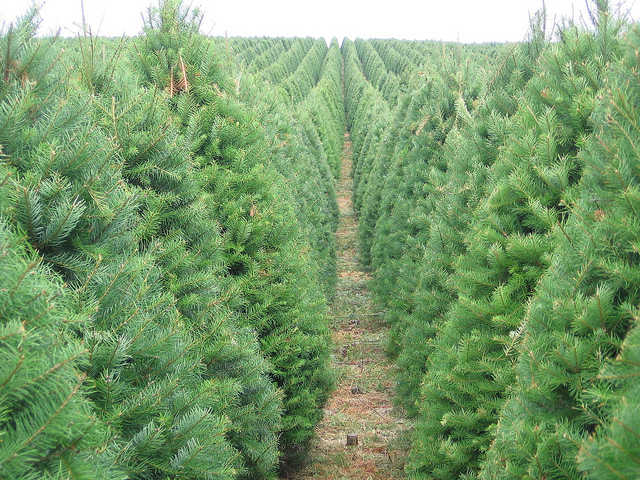
Cascadia is a global center of Christmas tree farming, harvesting approximately nine million trees per year. Christmas tree farms pepper the region’s landscape, covering nearly 100,000 acres across British Columbia, Oregon (the top Christmas tree-producing state in the United States), and Washington (the fifth-largest producer). Together, these farms may store more than 80,000 tons of CO2 annually, roughly equal to the emissions produced by 17,000 cars in a year.
But is fresh-cut the greener choice? Or are reusable plastic trees, like most reusable goods, the better option? Short answer: with rare exceptions, real trees are better, at least when measured by their climate impact. Here’s a look at some of the biggest sources of greenhouse pollution in the four phases of a tree’s life—production, transport, use, and disposal—based mostly on analyses conducted by Montreal-based consulting firm Ellipsos in 2009 and PE International in 2010.
Production
Manufacturing accounts for nearly 70 percent of total greenhouse gas pollution released during a fake tree’s lifetime (see this report, p. 53). Manufacturers fashion fake trees mostly out of two energy-intensive materials: steel and polyvinyl chloride (PVC), a versatile plastic with an especially polluting production phase.
In contrast, as natural conifers grow, they soak up carbon from the atmosphere and store it in the soil and their cells. Though estimates vary significantly, growing Christmas trees may sequester nearly one ton of carbon dioxide per acre (see page 8), depending on the type of tree, growing conditions, and a host of other factors. Although each tree releases a portion of this gas at the end of its life as it decomposes or burns, the new crop of replacement trees absorbs a similar amount of carbon.

Transportation
The tree in your living room probably traveled a long way to get to you, accounting for another portion of its carbon footprint.
If you have an artificial tree, it—like 80 percent of artificial trees—probably traveled 1) by truck from a factory in China to a port, 2) across the Pacific Ocean on a container ship, 3) on another truck to your local big-box store, before 4) you finally drove it home. All told, the tree crossed more than 8,400 miles (p. 31), emitting approximately 9 pounds of CO2 (p. 53), equivalent to driving a car more than 10 miles.

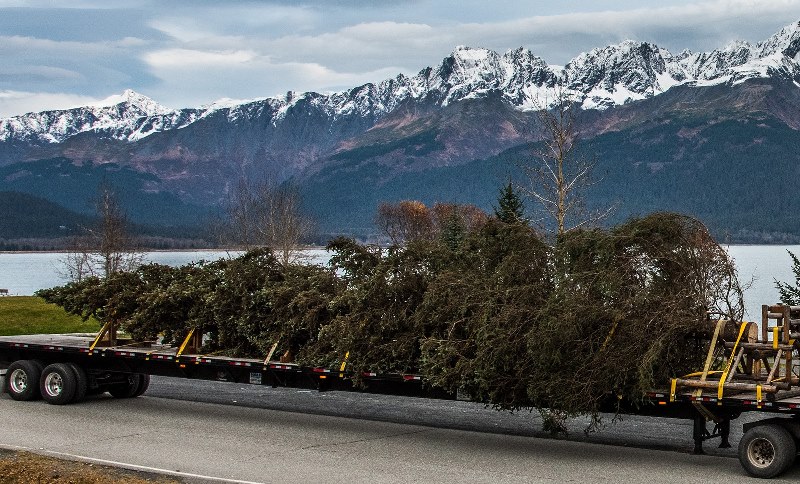
If the tree in your living room is natural, on the other hand, it likely journeyed far fewer miles than its fabricated counterpart. The typical US tree travels approximately 230 miles (p. 47) from 1) the site of seed production to 2) the nursery to 3) the farm to 4) the retailer and finally, 5) to a customer’s home. If you’re typical, you drove between five and seven miles to pick out your tree and bring it home (p. 31); yet these miles account for as much as 50 percent (p. 24) of your natural tree’s total carbon footprint, according to Ellipsos. Up until that point, your tree traveled with a pack of its peers, making transportation far more efficient than during those last few miles when it was just you, your car, and your tree.
The distance you drive to buy your natural tree is a main determinant in whether your tree is a net sink or source for greenhouse gas pollution over its lifespan. If the trip from home to retailer and back is ten miles or fewer, the tree can act as a net sink of greenhouse gases, according to PE International (p. 77). Beyond ten miles, it becomes a net source of emissions but may still have a smaller footprint than an artificial tree, depending on the rest of its lifecycle.
[button link='{“url”:”http://www.sightline.org/2012/12/31/a-look-back-at-a-year-of-nothing-new/”,”title”:”More tips on reducing your carbon footprint in our series: My Year of Nothing New”}’ color=”orange”]
Lifespan
The number of years you will reuse a plastic tree is another factor to consider when deciding whether to go natural or fabricated. Here’s why: the high environmental cost to produce and transport the artificial tree can be spread out over all the years it’s used, so long as it replaces a natural tree each holiday season.
If you drive a fairly standard 6 miles roundtrip to purchase an artificial Christmas tree, you need to use the tree for about 20 years to break even with the climate impact of 20 fresh evergreens, according to Ellipsos (p. 48), which assumes modest vehicle emissions per mile (see more in Notes below). The fake tree may break even with its rival a little sooner—somewhere around 12 years—if Ellipsos’s figures are too cautious and EPA’s higher car emissions estimate is correct. Either way, in North America, artificial trees typically see only six Christmases before hitting the waste heap (p. 5), far too few to make them the more climate-savvy option.
Disposal

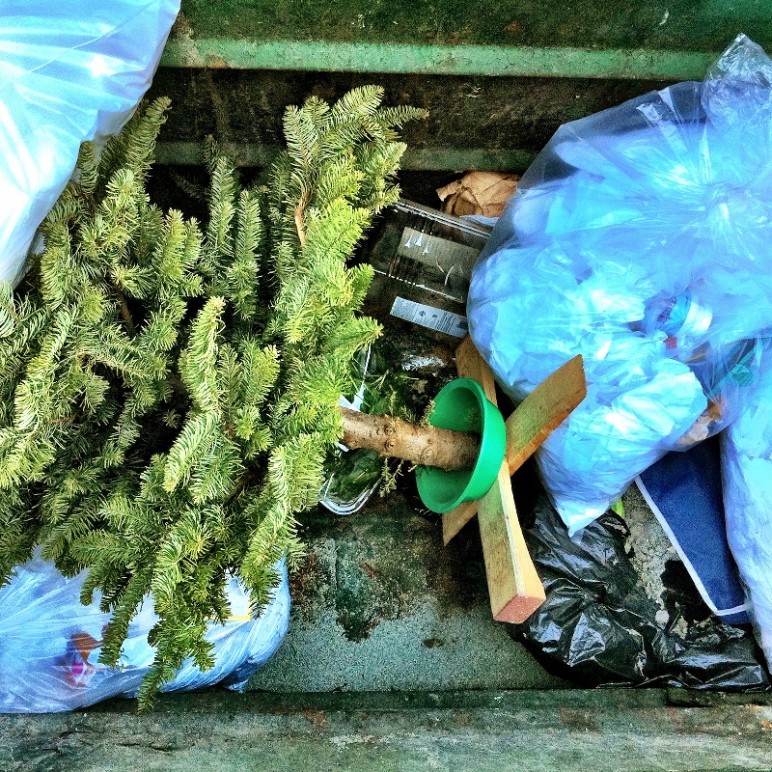
Finally, the disposal method of your Christmas tree influences its ecological impact. Though recyclers accept many components of a prefabricated tree (such as PVC and steel), most parts of Canada and the United States lack the infrastructure to separate these materials (p. 30). More than likely, when you get rid of your artificial tree, it will end up in a landfill. En route to the dump, the garbage truck will pump out more carbon.

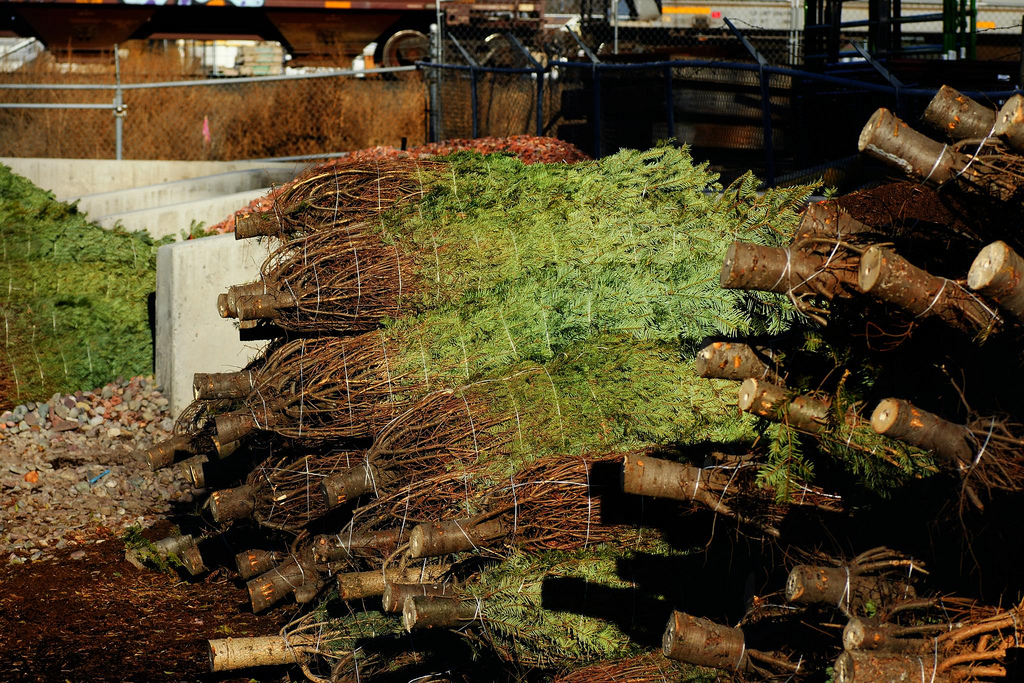
Composting a natural tree, or turning it into wood chips, makes the best sense from a greenhouse gas and nutrient perspective. Luckily, Portland, Seattle, and Vancouver, BC, all make it easy to compost your tree. Municipal solid waste haulers in all three cities collect residents’ used trees (so long as they’re cut into lengths of six feet or less) along with household yard waste in the two weeks following the holiday. Lots of other localities across Cascadia offer similar services, including King County, Portland Metro, and Metro Vancouver. (If you have disposal tips and links for other Cascadia locales, please add them in the comments!)
So, real or fake?
Usually, real evergreens are the greener Christmas trees. Cradle to grave, Ellipsos finds that an artificial tree decorated for six holidays before it’s tossed is responsible for nearly three times more greenhouse gas pollution than six trees fresh cut and composted (p. 6). Exceptions include if the tree farm that grew your tree replaced native forest, if you get a used artificial tree close to home, and if you keep your fake tree for at least two decades. In these cases, you’d do better to go plastic.
And of course, your choice of Tannenbaum certainly is not the most climate significant choice you will make this season. All told, your tree has a climate impact equivalent to driving roughly between 10 and 20 miles. So, bike to work a few days a year, and you’ve already offset your tree, no matter which type it is. Still, considering the rapidly growing popularity of artificial trees, this is one decision that is easy to make a little greener.
Of course, the best option of all may be to try something slightly less traditional. The internet is filled with clever DIY tree alternatives, many of which use handmade or reclaimed materials. (If you have a good one, send us a photo!) In a season when it’s easy to gripe about uninhibited consumption, why not make our trees a sign of living differently?
[button link='{“url”:”http://www.sightline.org/2015/12/22/ten-diy-sustainable-christmas-trees-that-reuse-recycle-upcycle-and-craft/”,”title”:”Want to reduce your carbon footprint even more? Check out these do-it-yourself alternative Christmas trees.”}’ color=”orange”]
NOTES ON METHODS AND SOURCES
Though I’ve tried to employ the most likely estimates of emissions where possible, studies vary significantly regarding the range of carbon dioxide impacts from many of the processes described in this article, resulting in a wide margin of error for many of the estimates presented here. Here are some of the largest sources of margin of error present in these calculations.
Studies vary significantly regarding CO2 sequestration on Christmas tree farms, ranging from a sequestration rate of 1.2 t of CO2 per acre to emitting as much as 0.2 tons of CO2 per acre annually (p. 43). Not surprisingly, this range makes all the difference. At the high end, with tree farms sequestering over a ton of CO2 per acre, a natural tree will always be a better choice from a climate perspective than a fake one. On the other hand, if conifer plantations work as sources of greenhouse gases, artificial trees will always be the better climate choice. I found no good data on this topic specific to Cascadian tree farms, and I assumed that Cascadian tree farms fall in the middle of the range, absorbing 0.8 tons of CO2 per acre per year. This assumption is a potential source of error in my analysis. I welcome input from experts on Northwest forest carbon flux.
Another important factor not considered by either lifecycle analysis cited here is what Christmas tree farm land may have been used for had it not been for the tree farm. There are a number of variables that make this hard to predict. As a result, this consideration has been left out of the analysis. Nevertheless, alterative land uses could result in significantly different carbon emissions or sequestration rates.
Thirdly, this analysis likely underestimates transportation emissions. Ellipsos’ assumption of CO2 emitted per mile by a standard car (p.8) is equivalent to only two-thirds of EPA’s 2014 estimate of gasoline emissions from a standard car: 411g CO2 per mile. (PE International’s car emissions estimate tracks closely with EPA’s.) Previous Sightline research suggests that even EPA’s figures may understate carbon pollution from gasoline by nearly one-third because they ignore releases of pollution “upstream” in the fossil-fuel extraction, refining, and transportation processes. For the purposes of this analysis, however, I relied largely on EPA’s 2014 estimate whenever possible. This includes any statement in which I put process emissions into context by comparing with car miles driven. I was not able, however, to incorporate EPA’s estimates into most parts of the Ellipsos study’s calculations; thus I have noted specifically when a transportation emissions estimate is based explicitly on a calculation from this lifecycle analysis. The estimate of overall climate impact of a Christmas tree presented at the end of this article (between 10 and 20 miles of driving) is based on the Ellipsos basic global warming potential calculations for natural and artificial trees (p. 8), contextualized into a driving mile equivalent using EPA’s 2014 driving emissions estimates.
Finally, I would like to note that the PE International study was commissioned by the American Christmas Tree Association (ACTA), an industry association for artificial tree manufacturers. The Ellipsos study was not commissioned by a client but was done for publicity and internal training purposes (private email communication from Ellipsos, December 18, 2015).


Comments are closed.