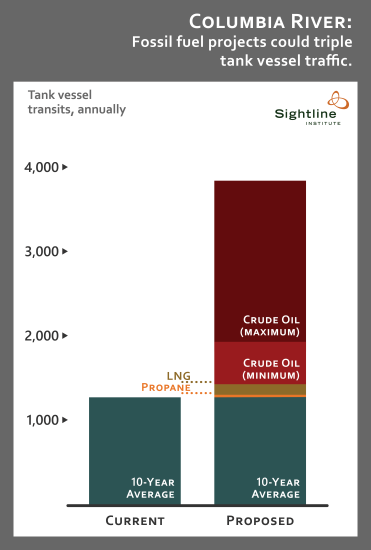
Like the Salish Sea, the Columbia River is threatened by the risks of oil spills. If you need proof of the risk, look no further than the historical record of major spills or the dozens of recent close calls on the river. In fact, the Coast Guard sector responsible for the region that includes Grays Harbor plus the Columbia and Snake Rivers responds to 275 oil pollution incidents in a typical year.
Yet the risk of spills could soon increase dramatically. If they are built, new fossil fuel shipment proposals would result in huge increases to both oil and other petroleum ship movements, as well as to overall large vessel traffic on the Columbia River.
Using the Washington Department of Ecology’s “Vessel Transit and Entry Counts” database, we calculate the average volume of ship and barge traffic over the last decade and compared that to the number of vessel trips that would be induced by newly built and planned fossil fuel sites in the region.
The result? We find that new crude oil and petroleum product facilities could triple the number of tank vessels—tanker ships and tank barges—crossing the Columbia River’s notoriously dangerous bar.

Original Sightline Institute graphic, available under our free use policy.
More loaded oil tankers and barges will increase spill risks in an obvious way. Less obvious yet still serious is the risk posed by a growing number of large vessels of any stripe moving down the Columbia’s channels and across its hazardous entrance to the Pacific Ocean. Especially important is another fossil fuel export proposal, the Millennium Bulk coal terminal planned for Longview, Washington, which would generate 730 new vessel transits on the river each year.
Compared to the entire fleet of large vessels on the Columbia, fossil fuel shipments (coal, oil, and petroleum product combined) could double overall major vessel traffic.

Original Sightline Institute graphic, available under our free use policy.
Our estimates are very likely too conservative because we do not count ancillary vessel trips induced by these fossil fuel projects, such as the refueling (“bunkering“) vessels that would be required to serve ocean-going cargo ships.
For a more complete accounting of fossil fuel vessel traffic serving these coal and petroleum sites, see the graphic below.

Original Sightline Institute graphic, available under our free use policy.
Notes and methods. The data we report here come from the Washington Department of Ecology’s “Vessel Transit and Entry Counts” database that we parsed into three regions: Puget Sound, the Columbia River, and Grays Harbor. Our figures refer to “transits,” which are ship movements, rather than “vessels,” which refer to unique ships. A vessel may make multiple transits in a given year, so estimating vessel traffic is best done using transit numbers. There are, however, some methodological wrinkles in the VEAT data, such as an apparent discrepancy in the way that barges and ships are counted. Barge transits are defined as “any significant move between two locations, via Washington State waters, while transporting oil or chemicals,” while ship transits are defined as “the passage of a vessel from sea or from Canadian waters into Washington waters…the trip back to sea is not counted.” In other words, a movement by a barge (between, say, two ports on the Columbia River) would be counted as a barge transit, while a similar movement by a ship would not be counted as a ship transit. Our estimates of future vessel traffic strive for consistency with VEAT’s method of tracking barge and ship movements.
Data for the Millennium Bulk Logistics coal terminal at Longview, Washington come from the Ambre Energy website here and the official permit review documents here.
Data for the Haven Energy LPS project at Longview, Washington come from the project website, here.
Data for the Tesoro-Savage project at Vancouver, Washington come from the project documents here.
Data for the NuStar project at Vancouver, Washington come from its Clean Air Agency Report filing. Only about 42 percent of the throughput will be crude, with the remainder being methanol and other chemicals.
Data for the Pembina Propane project at Portland, Oregon come the company’s project website.
Data for the Global Partners project at Clatskanie, Oregon come from state permitting documents here, especially the Oregon Department of Environmental Quality’s permit approval.
Data for the Oregon LNG project come from the Applicant-Prepared Draft Biological Assessment and Essential Fish Habitat Assessment.
For the three oil-by-rail terminals, we also used data in Sightline’s report, “The Northwest’s Pipeline on Rails,” as well as in the Washington Department of Ecology’s report, “2014 Marine and Rail Oil Transportation Study.” We made two estimates for oil from trains: the high estimate assumes that all oil is transported by tank barges carrying 150,000 barrels each. Tank barge capacities can vary widely, from as small as 10,000 to as large as 327,000 barrels; we chose 150,000 because it is the size that will be used at new oil terminals planned for Grays Harbor, and it seems to be slightly larger than typical tank barge average capacity. The low estimate assumes that all oil is transported in Panamax tankers carrying roughly 360,000 barrrels each, a figure that is consistent the throughput volumes and estimated vessel numbers for the Tesoro-Savage proposal at Vancouver.


