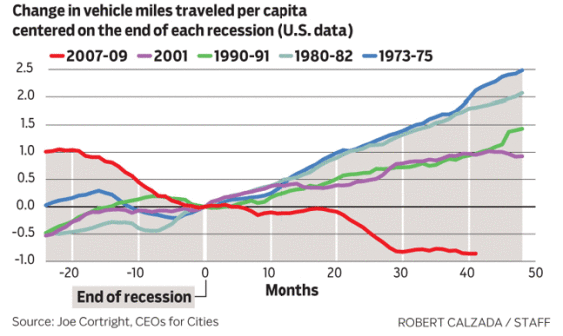
Here’s a fantastic chart from the Atlanta Journal Constitution, based on work by Portland-based economist Joe Cortright, showing the decline in driving since the end of the 2007-2009 recession (in red)—and how unusual that decline has been, compared with previous recessions.
We’ve covered all of this before, ad nauseum, but it still seems to surprise people: per capita driving has fallen considerably; total driving has been down or roughly flat; and you can’t just blame the recession. There’s something else much more fundamental going on—something that can’t be explained away by dips or blips in GDP.


Dennis Wurster
What are the units of the Y-axis? Percent? Miles?
Clark Williams-Derry
That’s a great question — it’s a pretty chart, but poorly labeled. I’m pretty sure that it’s percent, not miles — but I actually don’t know for certain.
M. S. Mangus
It says change in vehicle MILES per capita…
Clark Williams-Derry
Yes, but it’s not clear if it’s the percent change or absolute change in per capita VMT.
I have to assume that it’s percent change, since it doesn’t give the time unit. A one mile per year VMT decline is irrelevant. A one mile per day VMT decline is significant. The lack of a time unit makes me pretty certain that it’s a chart of percent change.
Dr. M
Recovery aside, GAS prices have continued to climb steadily. Perhaps people are rethinking their trips or simply being more strategic? I also wouldn’t put too much stock in a chart that declares a recovery when we’re not seeing concrete evidence to support it. I for one am riding my bicycle more but it is freezing cold and windy on the east coast in the wintertime so I’m driving my car.
Clark Williams-Derry
I agree–gas prices are the big impetus here. But I imagine there are other factors: the “recovery” (as you point out) has been anemic & uneven; plus young people are driving far less for a variety of reasons; plus the aging of the baby boomers is pulling down per capita driving, since folks tend to drive less and less after they hit age 50, and there’s a big Boomer cohort that’s now aging past their peak driving years.
So yes, there are a number of different dynamics going on–particularly gas prices–that are very different from past recoveries.
Fran
I wonder if adding cost to own + operate a vehicle, and consumer purchasing power would help explain of it.
Clark Williams-Derry
Part of it, probably. There are lots of economic, technological, policy, and lifestyle factors that play into the decline in driving. It’s hard to untangle all of the causes and effects…but it’s not hard to see that they’re adding up to a big change.
Jeff Dubrule
This recession lasted (is it actually over, honestly?) much longer than others. Long enough for car-leases to run out, and for people to exhaust savings and sell their cars to get out of the car-payment.
Combined with the foreclosure-crisis, a lot of people’s credit was wiped out, too.
Maybe a lot of Americans can’t actually buy or lease new cars, currently?
Clark Williams-Derry
Longer, and deeper too. But it looks like something is happening even among people who kept their jobs during the recession. According to this report from the Frontier Group…
“The average young person (age 16-
34) with a job drove 10,700 miles in
2009, compared with 12,800 miles in
2001.”
Tim Gent
Great series of blogs. I’m a UK modeller of transport and land use trends, and have followed this debate in the UK with interest.
Other than the theories about oil prices and aging population, do you know if anyone in the US has considered evidence for the following:
– Falling trip rates (e.g. people working from home more, job types requiring less travel)
– Denser urban living: people living closer to where they work.
In the UK we’ve struggled to see any change in Trip Rates (which surprises many people, and it may in fact be a case of the travel surveys not picking up changes that are there). I’ve carried out analysis of density using our recent Census and am starting suspect the ‘Urban Shift’ and job types plays a big role. Cause and effect difficult to entangle as ever – maybe people are moving to areas where they need to use cars less because of oil prices, but I suspect there’s more to it than that.
Clark Williams-Derry
Hi there!
I haven’t heard anything about falling trip rates here. That doesn’t mean it’s not happening; just that I haven’t heard about it.
That said, I’ve seen mention of falling mode share for cars — that is, a greater share of trips being taken on transit, on foot, or by bike. Whether that factors into an actual decline in the number of car trips — I don’t know.
As for denser urban living, I think the trends here in the US are mixed and hard to parse. There are definitely more people living in dense city centers. And some “inner rim” suburban cities have become more urbanized. Yet at the same time, we also had a lot of sprawl in the decade between 2000 and 2010. Part of that was fueled by the housing bubble — with lots of new housing developments at the urban fringe (some of which are now even more sparsely populated than they were, because of foreclosures).
So in short, I simply don’t know whether the US has actually urbanized much over the past two decades, on net! It’s something I’d have to parse out of the numbers — it’s unfortunately not the sort of thing about which one can simply rely on intuition or anecdotes — but I don’t have much more than that to go on right now.