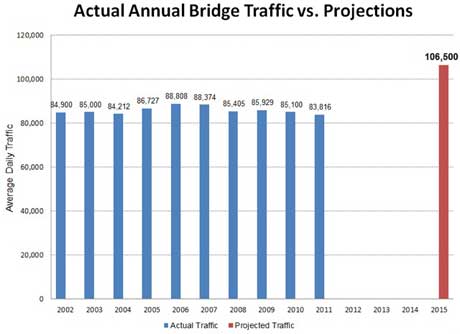
From a Willamette Live article, this chart virtually speaks for itself:
According to the article, the blue bars represent the combined traffic on two different bridges crossing the Willamette River in Salem, OR. The data show that traffic across the river has essentially flatlined for the last decade; there’s simply no evidence of growth. If anything, the numbers show a very slight decline, given that traffic reached a ten-year low in 2011.
Yet as recently as 2006, the state projected that traffic volumes would grow by 20 percent by 2015—as represented by the red line.
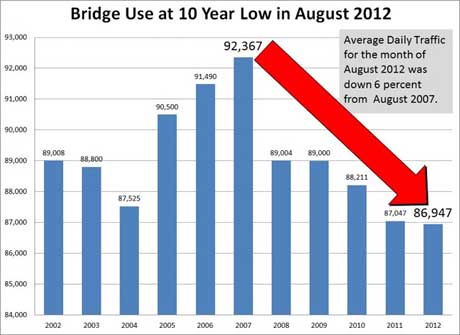
As the following chart shows, August 2012 saw further declines in traffic on the two spans.
In short, the official forecasts of traffic growth have proved preposterous. Perhaps they were made in good faith. But events have shown that the models that produced the projections are useless. No, strike that: they’re so deceptive, and leading to such poor decisions, that at this point they’re worse than useless.
Yet as has been so common throughout Cascadia—and beyond—transportation agencies have used these inflated traffic projections to justify big, expensive infrastructure projects. In this case, it’s a new bridge span across the Willamette and elevated highway. But the same pattern’s been seen all over: with the Columbia River Crossing in metropolitan Portland; the Gateway program in Vancouver, BC; the North Spokane Freeway; and, of course, all of the Seattle-area megaprojects underway or on the books. We’ve seen the same so many times now that I’m starting to wonder: how is it that the public, and their elected representatives, let this expensive, anti-environmental nonsense pass without a ruckus?


Comments are closed.