Oh, jeez, this is like shooting fish in a barrel: a picture-perfect demonstration of how not to estimate future traffic volumes.
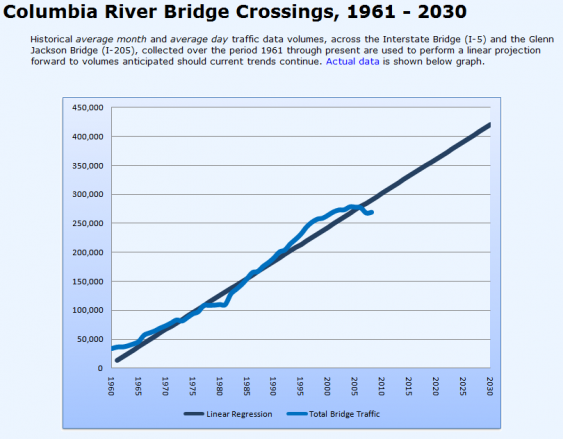
On the website of the Southwest Washington Regional Transportation Council, I ran across this doozy of a chart, showing projections for future traffic across the Columbia River between Portland, OR, and Vancouver, WA.

It seems that the chartmaker used a linear regression (which comes standard on most spreadsheet programs) to draw a straight line through traffic data from the early 1960s through 2010, and continue that line through 2030. Then—apparently with a straight face—the Transportation Council presents this line as a “projection” for future traffic volumes, “should current trends continue.”
And since the state of Washington itself hosts the page, you’d be forgiven for thinking that this kind of linear regression is a reasonable way to project future traffic volumes.
But wait, I can use Excel too! Here’s my take, based on the very same data plus a wee bit of historical context:
 When you present the chart this way, traffic across the Columbia River divides into three phases:
- The first phase (1961 through 1982), when there was just one bridge across the Columbia north of Portland, saw fairly consistent traffic growth.
- The second phase (1983 through 2001)—while both the I-5 and I-205 bridges were open, gas prices remained low, the baby boomers entered their peak driving years, and the Northwest economy hummed—saw even faster growth in traffic.
- During phase three (2002 to the present), gas prices started going up in earnest, rush-hour traffic on the CRC bridges neared saturation, the economy roller-coastered, and the baby boomers aged past their peak driving years—and traffic essentially flatlined.
So if you run a linear regression from “current trends”—where “current” is defined as the last decade, excluding what happened in the 1960s through 2001—you wind up with a “projection” of essentially zero traffic growth through 2030.

But more importantly, a linear regression on this data set can generate all sorts of different lines, depending on where you set the starting and ending points. In the animation to the right, I ran a series of linear regressions on the CRC traffic volume data. All of the regressions use 2010 as the endpoint, but the start date ranges from 1983 to 2004. The “projection forward should current trends continue”—the expression used in the transportation council’s chart—is practically whatever you want it to be; all you have to do is choose what you mean by “current trends.”
Luckily for you, I won’t insult your intelligence by claiming that any of these linear regressions represents a legitimate prediction of future traffic trends. An Excel linear regression just doesn’t count as a forecast. So just to be clear: I’m NOT predicting that traffic between Vancouver and Portland will remain flat indefinitely. All I’m saying is that running a linear regression, with no other information for context, is a nonsensical way to make a forecast of the future.
Instead, a real estimate of future traffic would look at macro-economic forecasts, land use projections, future gas prices and fleet mpg, population growth, population age structure, recent trends by age and demographic groups, and a host of other factors. Even with all of that baked in, of course, a forecast will almost certainly be wrong; very few predictions, even the most sophisticated and thoughtful, hit their mark. (For example, the actual track record of the Puget Sound’s transportation model is simply laughable.) But at least the Council would be able to explain their projections without getting red in the face.
As it stands now, though, a regional transportation planning group has presented a “projection” that’s essentially a meaningless, cherry-picked line. At the same time, I notice that the Southwest Washington Regional Transportation Council has voted to support a much wider I-5 bridge. One has to wonder: was their decision to support the wider CRC influenced by their simplistic projections? Or did they create the projection to help justify a decision they were going to make anyway? Either way, it’s a bit embarrassing.


Spencer Boomhower
This is awesome.
Marilyn Hair
Great explanation of how data can be interpreted.
Dan
Clark,
You are being too generous.
Walter R. Jorgensen
Clark Williams-Derry,
Would you next take a look at the population projections formulated by the Office of Financial Management?
These projections, as you may know, have a big impact on Washington citizens because they are transformed from predictions to prescriptions by the Growth Management Act, i.e., counties and cities must make land use and other preparations to accommodate their quota of the mandated new residents (mostly extra-state immigration).
In the late 60’s – early 70’s, I was the “computer staff” for the Section of the then Central Budget Agency, aka OFM, that produced the population projections and school enrollment forecasts, as they were called. With all the statistical machinations we visited upon the empirical data with SAS and other statistical tools, I was always amused to note that I could place a ruler over a line chart of ALL the previous data points and come up with the same general conclusion that all the programming and analysis discovered.
Now in my role as a former elected official (Tumwater City Council) and community activist (The Carnegie Group), I am chronically troubled by this self-fulfilling prophecy of more and more people.
Can you critique the OFM process to see if their conclusions are justified?
Eric Rehm
Thanks for a careful look at the misuse of linear regression of historical traffic volume data against a single variable (time) as a defacto predicitive model for the future. The other questions we should be asking aren’t statistical, like:
– Do we want to live in a world so much traffic?
– What cn we do to reduce traffic volumes?
– What is the relationship between transportation volumes and toxics in our waterways (e.g., copper brake linings) and climate change (additional human-produced CO2)?
We can answer all of these questions in a away to influence the outcome, rather than this attitude, justfied by bad science, of “destiny destiny, no escaping that for me” (a wink to Mel Brooks’ “Young Frankenstein).
Joseph D (Dave) Jannuzzi
One other thing that might impact their “projection” is that improvements along the rail corridor and more passenger rail will reduce congestion even further.
Kenny
And then there is the fact that traffic congestion behaves more like an ideal gas than anything – it expands to fill capacity. Building more capacity doesn’t allow traffic to continue following current trends, it reduces the cost of getting other places and as such encourages the use of that passage.
Pete
Modeling data with a regression line is only appropriate if the data are independent. Time series data, such as those presented in the graph, are typically not independent because they have a significant autocorrelation. This is because one year’s value is strongly related to the prior year’s value. Consequently, it is often not appropriate to put a regression line on a scatter plot of time series data. Extrapolations based on such a regression line are seldom of value.
Paul Edgar
ODOT & WSDOT have a bridge to sell you and they will do what every they have to do, even lie or turn some faults-hoods into their graphs.
With the need for tolls on a new CRC Bridge to be at $10.00 per trip in 10-years with reduced usage, reduced number of Washingtonian’s not being able to afford living in Washington and working in Oregon, at that cost the incidents of travel will be even much less.
Common sense tells us not to trust these government graphs.
Ben Horner-Johnson
I pulled the data from the original web site table and ran the linear regression functions in OpenOffice (why buy Excel?). R-squared for the linear regression is 0.97 (max 1.0). I also found the correlation coefficient R=0.987, which means a linear model can explain 98.7% of what’s going on, which is probably why they use it (also it’s easy to plot).
Pete’s comment about auto-correlation is spot on, too.
Alex Broner
It looks like the picture and text on the website been modified, perhaps as a result of this article?
Phineas Baxandall
Great post. True at the national level too.
Chet
We’re a group of volunteers and opening a new scheme in our community. Your website provided us with valuable information to work on. You’ve done an impressive
job and our whole community will be thankful to you.
Remmar Gorpa
Science … no one’s mistress, everyone’s concubine.