The Northwest is home to more than 1.4 million people who self-identify as Hispanic or Latino. In this installment of my ongoing analysis of the region’s demographics we’ll take a closer look at the geography associated with Northwest Latinos. (Past examinations have included Chinese American and black residents.)
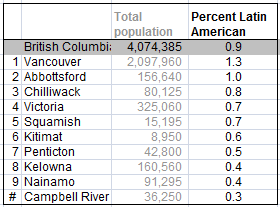
Overall, the three Northwest states have remarkably similar shares of Latino residents. Oregon’s population is 11.7 percent Hispanic, compared with 11.2 percent in both Idaho and Washington. In British Columbia, by contrast, less than 1 percent of residents claim Latino heritage.
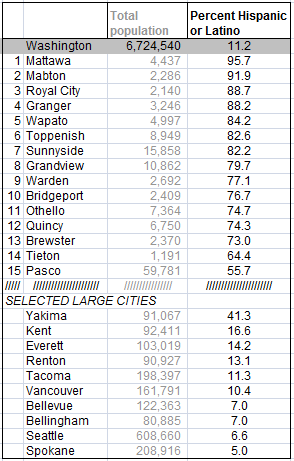
Uniquely among Northwest jurisdictions, Washington has more than a dozen municipalities with overwhelmingly Hispanic populations.
All of Washington’s majority-Latino cities and towns lie to the east of the Cascade Mountains. Cities on the western Columbia Plateau (Mattawa, Royal City, Warden, Othello, and Quincy) and cities in the lower Yakima Valley (Mabton, Granger, Wapato, Toppenish, Sunnyside, and Grandview) dominate the rankings. With the exception of Pasco, all of Washington’s majority-Latino places are small towns.
Among Washington’s bigger cities, Yakima has easily the largest share of Latino residents at 41.3 percent. The big Puget Sound-area cities look roughly like the state average (although Seattle and Bellevue both come in below the statewide average). Spokane also has relatively few Hispanic residents for a city of its size.
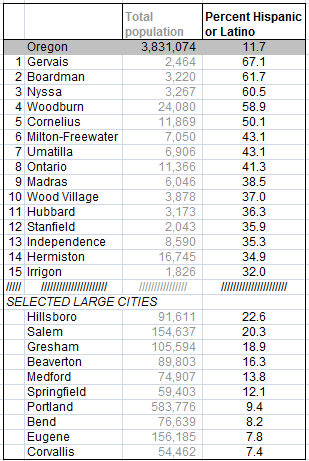
Oregon’s Latino population is somewhat more dispersed than Washington’s. Only five Oregon cities have majority-Latino populations, and Oregon municipalities with high Latino populations aren’t concentrated in small towns east of the Cascades.
Oregon’s most Latino city, Gervais, is west of the Cascades, nestled in the Willamette Valley between Portland and Salem. Woodburn and Hubbard are nearby, and Independence is not far away. Cornelius is on the western fringe of the Portland metro area, while Wood Village is on the eastern. Among Oregon’s big cities, several Portland suburbs stand out, places like Hillsboro, Gresham, and Beaverton. The majority of Oregon’s heavily Hispanic cities, however, are in eastern Oregon, particularly in the north.
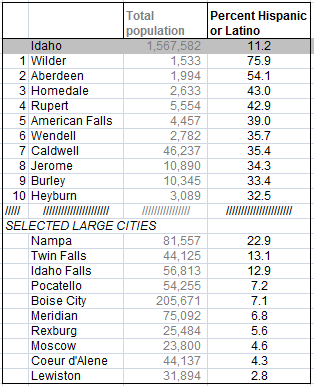
In Idaho, the Latino population is concentrated in the south part of the state.
Idaho’s top cities include listings in the populous Treasure Valley (Wilder, Homedale,and Caldwell) as well as the swath of agricultural country stretching along the southern tier of the state (Wendell, Jerome, Burley, and Heyburn) to the region around Pocatello in the southeast (Aberdeen, Rupert, and American Falls).
Idaho’s largest cities reveal the same pattern. Cities outside of southern Idaho—Moscow, Coeur d’Alene, and Lewiston—have relatively few residents of Hispanic or Latino origin.
By contrast to the Northwest states, British Columbia has few people of Hispanic origin.
Only the Vancouver and Abbottsford areas can claim that even 1 percent of their population as Latino. (Please note that figures for BC are not directly comparable to the states, and that this list covers metro areas rather than individual cities or places. More details are in the “notes and methods” below.)
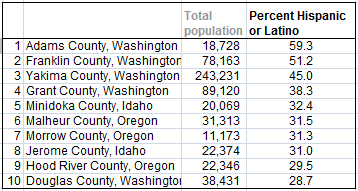
Finally—because some readers have asked to see county-level rankings—here are the Northwest’s top 10 counties for percentages of Latino residents.
In a follow up post I’m going to take a closer look at the Latino population in Lane County, Oregon home to Springfield and Eugene. Stay tuned.
Notes and methods: For US jurisdictions, I used data from the US Census Bureau’s demographic profile, “Table QT-P3: Race and Hispanic or Latino Origin: 2010.” Data refer to residents who self-identify as “Hispanic or Latino (of any race).” My city tables exclude places with fewer than 1,000 residents; my county table excludes places with fewer than 10,000 residents. For BC, I used StatCan’s data from the 2006 Canadian Census, the most recent available. All data come from “Population Groups (28) and Sex (3) for the Population of Canada, Provinces, Territories, Census Metropolitan Areas and Census Agglomerations, 2006 Census – 20% Sample Data.” To increase the comparability to the US numbers, the figures I report combine those who identified as “Latin American” with those who identified as “White and Latin American.” Data in BC are for Census-defined metropolitan areas and census agglomerations.
It’s worth noting that many in the Latino community believe that Census figures systematically under-count Latinos, perhaps by a lot.
In this post I’ve used the terms “Latino” and “Hispanic” interchangeably.
Big thanks to Clark Williams-Derry who did a lot to make the writing intelligible.

Comments are closed.