This week I’ve been working on the data for the economic security chapter in Sightline’s next volume of Cascadia Scorecard. (The sneak preview is that a few things are looking up and a few things… well, not so much.) According to the most recent data, poverty rates are slightly down, but child poverty rates are slightly up. Unemployment has dropped a bit. What never fails to astonish me, however, is how poor our progress has been on average income.
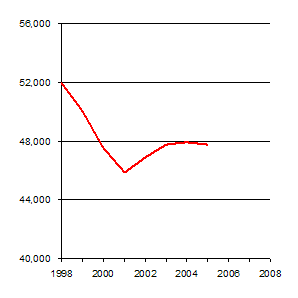
Here’s a chart showing household median income in the three Northwest states—Idaho, Oregon, and Washington. (By definition half of all households make more than the median income and half make less.) And yes, I totally cherry-picked the starting date, 1998, to make my point clearer.
This is not stellar progress. When the data series ends, seven years after the peak of the boom in the late 1990s, average Northwest households are still more than $4,000 poorer. (Inflation-adjusted, of course.) This is not, to my way of thinking, the sign of a roaring economy.
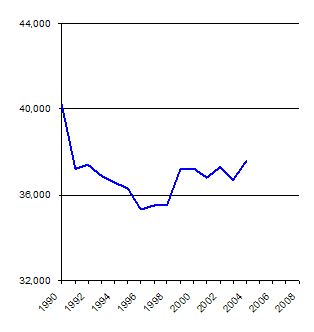
And it’s actually an even worse story in British Columbia.
Again, I cherry-pick the starting date of this graph, 1990, to make my point.
Again, not exactly stellar progress. (Also, inflation-adjusted.)
No additional remarks right now. I would just like everyone to bear this in mind the next time we see headlines about “strong economic growth,” where the “strong economy” refers to that magical accounting fiction of GDP, instead of dollars that actual people put in their pockets.







CatherineRobbins27
One remembers that modern life is expensive, but different people need cash for various stuff and not every person gets big sums cash. So to receive some loans or student loan will be a right way out.