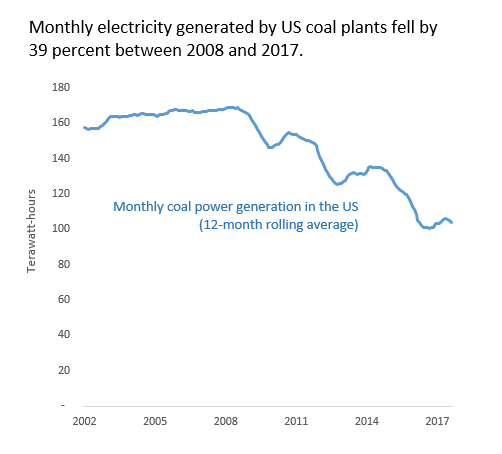
 As the chart to the right shows, coal consumption in the United States has been trending downward for nearly a decade. And if you’ve paid attention to the public debate, you probably heard two competing explanations for coal’s collapse.
One narrative—the one that the coal industry wants us all to believe—holds that federal policymakers waged a relentless “war on coal” over the past decade, and that reversing anti-coal policies will breathe new life into the industry. The other explanation—offered up by, well, just about everyone who doesn’t work for a coal company—holds that coal-fired power has become an outdated technology, steadily losing out to cheaper alternatives.
This second narrative is closer to the truth. Yet as reported in the press, the story often lacks nuance. Many accounts present coal’s decline simply as a triumph of “fracking,” with electric utilities ditching coal for cheap methane gas from fracked wells.
Yet new numbers show from the US Energy Information Administration (EIA) show that the “gas beats coal” story is incomplete. Fracked gas certainly played a role in coal’s decline. But collectively, wind, solar, and energy efficiency loom even larger.
Let’s look at those numbers, shall we?
Coal-fired power generation in the United States hit an all-time high in early 2008, with coal plants producing a monthly average of 169 terawatt-hours of electricity—or just a smidge under half of all power produced in the country. (Nerd caveat: because power generation fluctuates with the seasons, I’ll look at running 12-month averages throughout this article, not individual months. Also, a terawatt is equal to a trillion watts—but you already knew that, right?) But by August 2017, that figure had fallen below 104 terawatt hours—a staggering 39 percent drop. Power from burning oil and petroleum byproducts lost ground as well. Together, monthly generation from the two dirtiest fossil fuels fell by 68 terawatt-hours over the period.
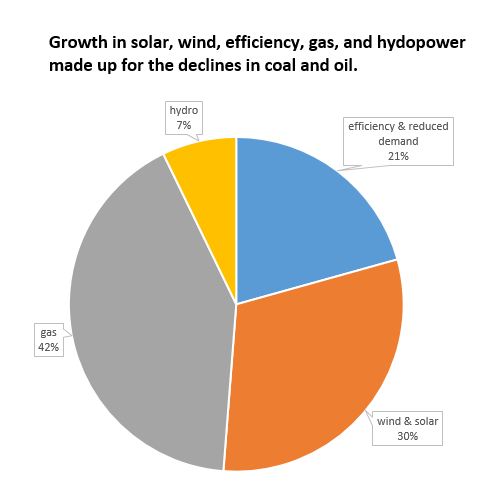
What took the place of coal and oil in the United States electricity generation mix? Natural gas was the biggest winner: monthly power output from natural gas plants grew by 28 terawatt-hours over the period.
But renewables weren’t far behind. Monthly power from utility-scale wind and solar installations grew by almost 21 terawatt-hours between early 2008 and late 2017. If anything, this figure understates the growth in green power, since it excludes rooftop solar, which the EIA only started tracking in 2013—but which has already notched major gains.

Surprisingly, the third biggest winner from coal’s decline was…nothing at all! A combination of gains in energy efficiency and economic shifts trimmed monthly US electricity consumption by about 14 terawatt-hours since 2014—a notable achievement, given the growth in both population and economic activity. Finally, monthly generation from hydropower—always a wild card—grew by nearly 5 terawatt-hours over the period.
These four factors—gas, utility-scale wind and solar, efficiency, and hydropower—made up essentially all of the ground lost by coal and oil. The chart to the right shows the split among those four factors. Clearly, gas gained more market share than any other power source. But efficiency and renewables together mattered more.
I think we can find a couple of lessons buried in these numbers. First, King Coal doesn’t just have one foe; it has many. Energy analysts typically focus on cheap natural gas as the chief culprit in coal’s slow-motion demise. But the numbers suggest that wind, solar, and efficiency collectively have emerged as equally potent threats. Second, coal will remain under pressure for the foreseeable future, as the rise of low-cost renewables continues to trim power prices and squeeze coal profit margins.
So while the coal industry may still hold out hope that a reversal of federal policies will revive their fortunes, the numbers suggest that the odds remain stacked against the nation’s dirtiest power source.
[list_signup_button button_text=”Like what you|apos;re reading? Get our latest fossil fuel research here.” form_title=”Fighting Fossil Fuels” align=”center”]


Comments are closed.