British Columbia’s Pacific Coast is home to prolific salmon runs, pristine shorelines, and a rich archaeological history. Yet amid these natural wonders, the fossil fuel industry has sited proposals for nineteen liquefied natural gas (LNG) developments that would greatly increase tanker traffic navigating remote island channels with strong currents and tides.
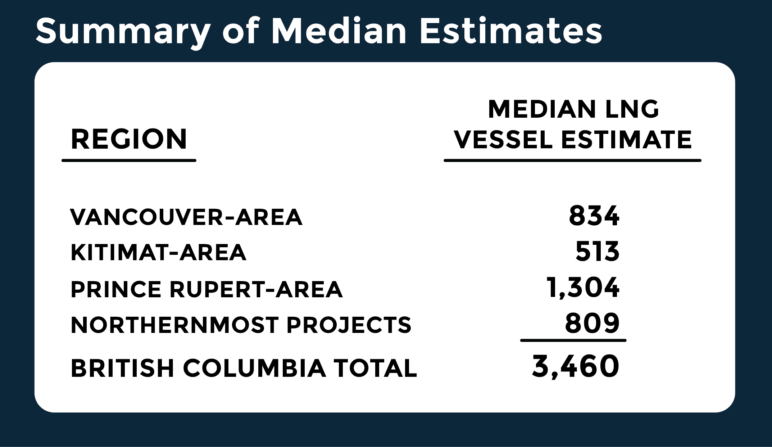
To make clear the scale of the provincial government’s LNG gamble, we calculated the possible cumulative increase in marine traffic: over 3,400 large LNG tankers, or more than 6,800 annual transits. Even using conservative assumptions, LNG tankers could add more than 800 large tankers to the annual vessel traffic around Vancouver Island and could increase vessel traffic along the Northwest coast by over 2,600 vessels annually.

LNG vessels: Giants of the sea
Transportation of methane gas, often known as “natural gas,” is limited when the fuel is in gaseous form. Pipelines are the primary means of moving the gas, which limits its delivery range. But liquefaction reduces its volume to 1/600th of its gaseous state and enables the LNG industry to ship large quantities overseas and then convert it back to a gas at its destination. The first oceangoing LNG ship, the Methane Pioneer, was a converted cargo vessel that sailed from Louisiana to the UK in 1959. By the end of 2016, there were 439 LNG tankers in the global LNG fleet, according to the International Gas Union.
A typical LNG tanker has a hull that is approximately 300 meters long—about the length of three American football fields—and fifty meters wide. The vessels are so large that Seattle’s Space Needle could be stowed in the hold. The average LNG tanker can store around 160,000 cubic meters (m3) of LNG, but the projects proposed for BC’s coast would likely see even bigger vessels. Of the nine projects that have so far provided estimates, six propose using the largest ships on the market: Q-flex and Q-max vessels. The Q-flex vessel can hold up to 217,000 m3of LNG, while the Q-max can hold up to 266,000 m3. The Q-max is about 345 meters long, or three-and-a-half football fields.
Thus far, fewer than half of the LNG proposals have provided vessel traffic estimates, and those that have done so cite an improbable vessel size. Although most of the project backers that have provided estimates refer to Q-flex and Q-max vessels, there are not nearly enough ships of this size available to manage the sheer volume of BC’s LNG proposals year-round. Q-class vessels make up only 11 percent of the global LNG fleet. By comparison, standard capacity vessels (125,000-150,000 m3) account for 49 percent of the global fleet, while vessels in the 150,000 to 180,000 m3 range account for 36 percent. Based on the actual size of ships in the global LNG fleet, it’s more likely that BC’s LNG facilities would use a combination of vessel sizes, most of them smaller than Q-class vessels. As a result, facilities would require more vessel transits per year to deliver the very large production volumes the industry has planned.
Vancouver, Kitimat, Prince Rupert, and Kitsault areas to handle hundreds more vessels each annually
Sightline estimates that LNG tankers could add over 800 ships to the annual vessel traffic around Vancouver Island and could increase vessel traffic along the Northwest coast by over 2,600 vessels annually. Since each vessel has two transits (coming and going), that’s more than 1,600 new transits around Vancouver Island and more than 5,200 new transits along the northern coast of BC.

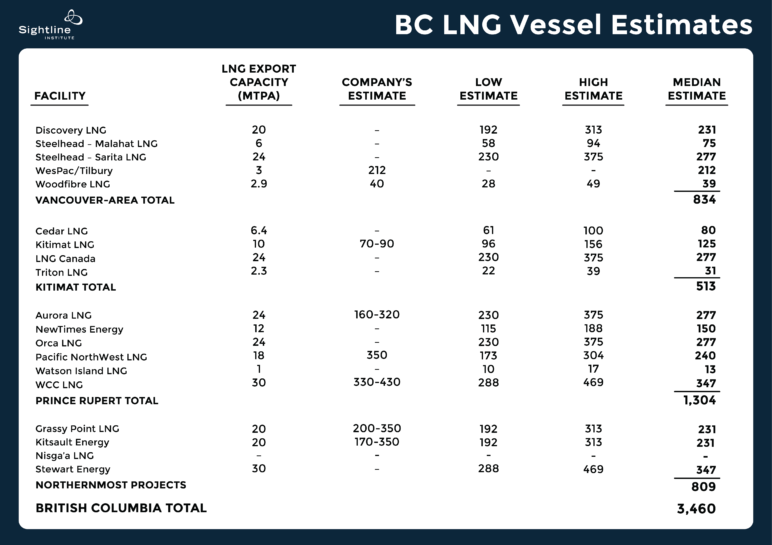
Our estimates are somewhat conservative because they assume that most facilities will not achieve their maximum production volume. The average capacity utilization of LNG facilities around the globe was 84 percent between 2010 and 2016, partly due to the glut of LNG on the world market. In 2016, LNG facilities worldwide produced about 82 percent of their maximum production volume, down from 84 percent in 2015. Accordingly, we calculated three capacity utilization scenarios: 82, 90, and 95 percent, representing the actual utilization in 2016 and two capacity utilization scenarios under stronger market conditions, since the market will need to improve for the projects to feasibly advance. We then calculated a median estimate for vessel traffic to each facility based on capacity utilization and vessel sizes represented in the global LNG fleet.
Accurate vessel traffic estimates are important because they help reveal the real risks that the LNG industry poses to Canada’s Pacific Coast. Almost certainly, a large increase in tanker traffic would have negative repercussions for recreational and commercial fishers, the First Nations and tribes that rely on coastal waters for their livelihood, and other coastal communities. Until the project backers—and the government regulatory agencies tasked with reviewing the projects—provide complete and accurate information about vessel traffic, communities will be unable to make an informed decision about just how much BC’s aggressive pro-LNG exports strategy risks the province’s unique coastal resources.
Methodology
Our estimates do not count ancillary vessel trips, such as the refueling (“bunkering”) vessels that serve oceangoing cargo ships that run on diesel, nor do they count tugboats that will accompany the tankers.
One facility, Tilbury/Wespac LNG, differs from the others in that it intends to export LNG to the US rather than Asia, using vessels of 90,000 m3 capacity, and bunker LNG as fuel using vessels of 4,000 m3 capacity. For this facility, we used the numbers provided by the project backers. Another facility, Nisga’a LNG, has yet to apply for an export license, so its volume is unknown; we made no estimate for this facility.
For the remainder of the facilities, we calculated vessel traffic using assumptions of 82 percent capacity utilization, 90 percent capacity utilization, and 95 percent capacity utilization. For each utilization assumption, we calculated vessel traffic using small and large vessels, the average size of tankers in the global fleet, and the likely average vessel size that will visit each facility, given its production volumes. This yielded four vessel traffic calculations for each utilization scenario, or twelve calculations for each facility. The “low estimate” in our table represents the lowest of the twelve calculations, and the “high estimate” represents the highest of the twelve calculations. The “median” in our table is the median figure of all twelve estimates generated per facility.
To calculate small vessel estimates, we used vessel size 135,000 m3, and for large vessels we used 190,000 m3. We used 160,000 m3 for the global fleet average. Our calculations of likely vessel size per facility were based on the facility’s production volume and the current makeup of the global LNG fleet.
While most of our vessel estimates fall within the range estimated by the facility backers, there are two instances where the facility backers’ estimates fall outside of our range. The range provided by Kitimat LNG is lower than our lowest estimate, suggesting that the project backer has some degree of certainty that it will be using very large LNG tankers for all trips. The figure provided by Pacific NorthWest LNG is 350 vessels, which is greater than our highest estimate. This suggests that the project backers have some degree of certainty that they will be using vessels smaller than the conventional “small” LNG tanker size of 125,000 m3.


Comments are closed.