In its 2015 report, the Oregon Global Warming Commission offers the Oregon legislature a path towards transforming the state’s economy and meeting its statutory global warming pollution limits. Its scenario for meeting the state’s emissions limits looks like Thanksgiving dinner with all the fixin’s: a price on pollution, plus a package of complementary clean energy, energy efficiency, and transportation policies. The Commission, which includes representatives from the environmental community alongside the CEOs of Portland General Electric and Northwest Natural Gas, and representatives from Intel and the Port of Portland, unanimously approved the report.
Here are 8 takeaways.
1. Oregon has broken the link between global warming pollution and GDP.
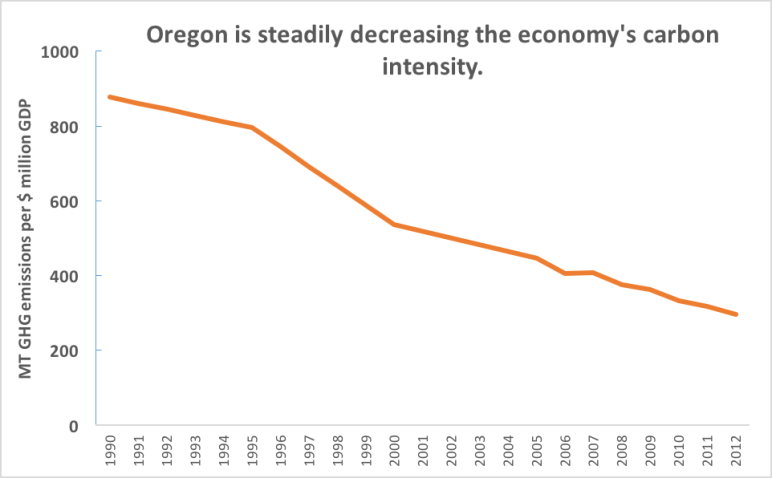
Oregon’s economy and population have boomed in the past 25 years; yet its greenhouse gas pollution levels have been relatively flat, meaning that the carbon intensity of the Oregon economy (how many tons of pollution it emits per dollar of GDP) has been steadily decreasing.
2. Nonetheless, Oregon has further to go to de-carbonize its economy.
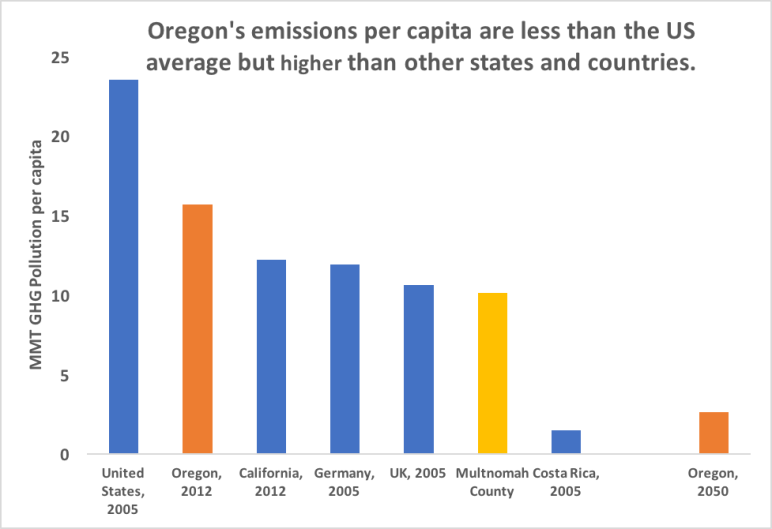
The report points out that Oregon has kept emissions relatively flat even as its population has increased, causing emissions per capita to drop since 1990. The City of Portland and Multnomah County—which do climate planning together—in particular have been very successful at promoting a low-carbon economy. Per capita emissions for this area are about half that of the United States average! But Oregon’s per-capita emissions are still higher than most prosperous European countries’ and will drop even further as Oregon transitions to a clean-energy economy.
3. Oregon met its statutory requirement to start reducing emissions by 2010.
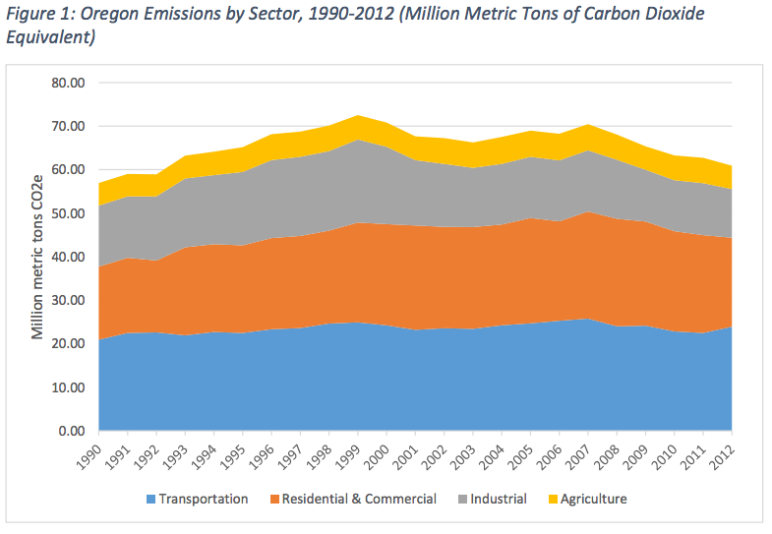
Oregon greenhouse gas emissions peaked in 1999 and have declined 16 percent since then, almost returning to 1990 levels. Oregon complied with its statutory (bot non-binding) goal to arrest the growth of and begin reducing greenhouse gas emissions by 2010.
4. Current policies will likely keep Oregon emissions flat through 2035.
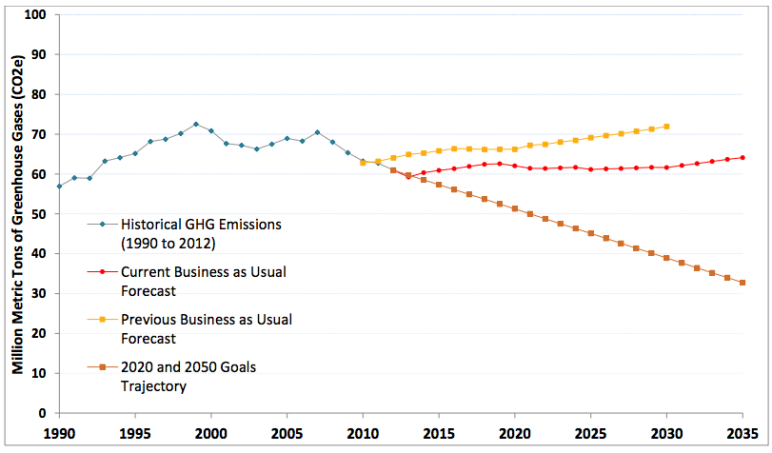
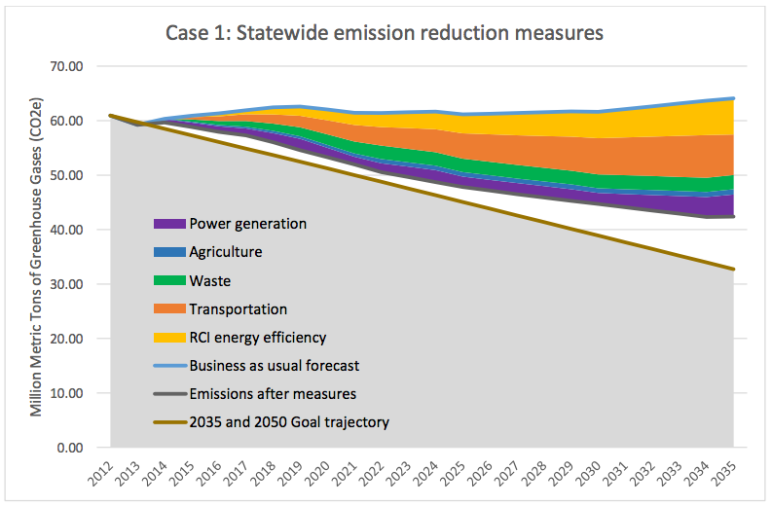
The Commission’s 2013 report predicted that “Business-As-Usual” (BAU) emissions would grow slightly through 2030 (yellow line in graph below). The 2015 report includes new or improved estimates of several pollution-busting policies in the Beaver State:
- Oregon’s 25 percent Renewable Portfolio Standard (RPS): By 2025, Oregon’s three largest utilities (Portland General Electric, PacifiCorp, and Eugene Water and Electric Board) will provide 25 percent of their power from renewable sources.
- Portland General Electric’s plan to shut down the coal-fired power plant at Boardman by the end of 2020
- Utility plans to invest in energy efficiency via the Energy Trust of Oregon
- The Clean Fuels bill passed in 2015: By 2025, transportation fuel sellers will decrease the lifecycle greenhouse gas emissions from their fuels by 10 percent.
- Clean Cars standards: Oregon is one of 14 states that have adopted standards requiring car manufacturers to cut emissions from the cars they sell in the state.
With all those policies in place, Oregon emissions will stay roughly flat for decades, only rising to 64.1 million metric tons (MMT) in 2035. The red line below shows this new improved forecast.
5. Unfortunately, Oregon is going to over-pollute in 2020.
Oregon has stopped digging deeper into a hole by putting into place policies that halted emissions’ growth. But climate stability (and Oregon statute) require the Beaver State to take the next step and act to drive emissions down, not just stabilize them. Oregon is supposed to cut pollution 10 percent below 1990 levels by 2020. But with 2020 just around the corner (yikes!), the Commission admits that Oregon will most likely miss that goal.
6. Therefore, Oregon should set its sights on 2035.
Oregon’s next statutory target—cut carbon pollution 75 percent below 1990 levels by 2050—is so far out that the Commission recommends setting an interim goal of trimming pollution 44 percent below 1990 levels by 2035 (the brown line above). This target means scaling down from the current 60.7 MMT of pollution per year to 32.7 MMT per year 20 years from now. Twenty years is a reasonable planning horizon. Indeed, it is the horizon that utilities use when making their resource plans, and Metro also uses a 20-year plan. Meeting this 2035 goal would put Oregon on the path to hits its 2050 goal.
7. Without a price, even aggressive regulations will not keep Oregon on track.
The Commission modeled an avid package of regulatory measures designed to trim emissions across the economy.
The measures to reduce residential, commercial, and industrial use of electricity and natural gas include:
- Weatherizing buildings
- Making better use of daylight
- Installing more efficient lighting, air conditioning, and appliances
- Upgrading industrial processes and storage
Oregon’s demand for electricity is expected to grow at about 1.2 percent per year for the next few decades. Implementing the measures above would reverse that trend line and actually decrease electricity load by 0.10 percent through 2030, reducing statewide electricity demand by a total of 4 percent in 2035. This achievement would be spectacular, making it easier to ramp down extraneous fossil fuel power and cheaper to provide clean energy to Oregonians. To achieve it, Oregon would need to double the Energy Trust of Oregon’s current efficiency plans.
The Commission put together a similarly ambitious set of measures in the transportation sector:
- Making land use changes to enable getting around by bus, bike, and foot
- Investing in public transportation
- Implementing pay-as-you-drive insurance
- Shifting away from single-occupancy vehicle trips to ride-sharing and transit
- Using intelligent transportation systems and transportation demand management
- Implementing parking management
- Increasing vehicles’ fuel efficiency
- Increasing deployment of electric and plug-in hybrid vehicles
The report includes more measures to decrease emissions from goods movement, air travel, waste management, and agricultural practices. Even this comprehensive package of regulations falls short of reaching the interim 2035 pollution limit, illustrated by the gap between the colorful emissions reduction wedges and the brown goal trajectory in the graph below.
8. Oregon needs a price on pollution.
The Commission used Portland State University’s modeling to show that a carbon tax starting at $10 per ton and increasing to $60 per ton, in combination with the policies described above, would get Oregon to its 2035 pollution limit. PSU modeled a quickly escalating tax—reaching the maximum level of $60 per ton within the first 5 years and then staying at that level through 2035. The graph below indicates that such a sharp lift-off may not be necessary: Oregon’s emissions (gray line below) would dip far below its emissions goal trajectory (golden-brown line below) by 2020 and then flatten out to nearly make the 2035 goal.
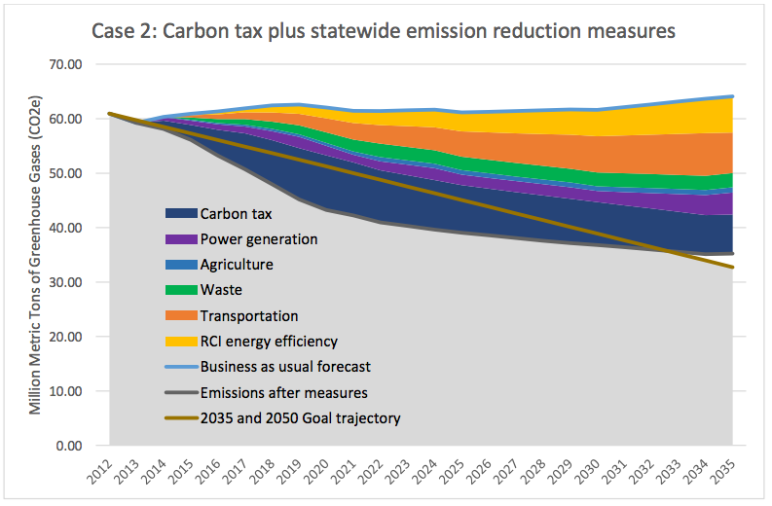
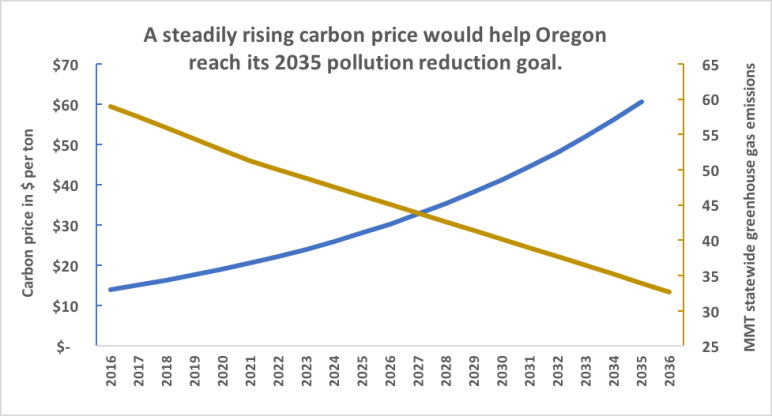
The sharply dropping gray emissions line above suggests a slower price increase might achieve a steadier, straighter reductions path. A cap-and-trade program designed to keep emissions exactly on Oregon’s goal trajectory (golden-brown line below), in combination with the package of complementary policies described above, would likely result in a carbon price starting around $13 per ton and increasing at a rate of around 8 percent each year, reaching $61 per ton in 2035 (blue line below).
Conclusion
Oregon is moving in the right direction: breaking the link between GDP and pollution, hitting its 2010 statutory pollution limits, and putting policies in place that will keep emissions flat even as the state’s population continues to grow in coming decades. But to really break free of fossil fuels and transition to a low-carbon economy, it is clear that Oregon needs a meaningful price on carbon pollution.


Comments are closed.