2014 was a big year for Sightline, inside and out. We took deeper dives into family-friendly urban policy, money’s influence on our democracy, and making polluters pay for their carbon pollution. We also continued our leading research on coal and oil exports out of Cascadia; traffic trends, transit funding, and rideshare safeguards; and a number of other key topics for promoting sustainability across the Northwest. And you, dear reader, you dove right in with us! Thanks for a great year of wonking out, and cheers to 2015! Now a look back at your faves:
14. Bertha vs. the Bus: As Seattle prepared to vote on key funding for King County public transit earlier this year, a snappy infographic from Jennifer Langston proved a jaw-dropping comparison between the cost of digging a single foot of Seattle’s doomed tunnel and that of funding a better transit system.

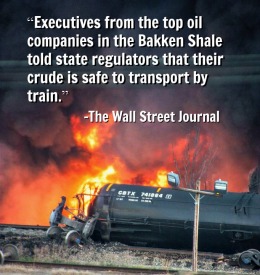
Lynchburg, VA, Derailment by LuAnn Hunt (All rights reserved, used with permission.)
13. New “Safer” Tank Cars Were Involved in Lynchburg, VA, Oil Train Fire: In which we saw (again) that no, Big Oil and rail companies’ claims about their industry’s safety do not in fact hold up.
12. Why Bakken Oil Explodes: Eric de Place explains why that particular strain of Dakota-originated oil rolling through our backyards and along our shorelines is exceptionally flammable.
11. Bad News for Ridley Terminal: They say bad news sells better than good news, perhaps especially when it comes to a major coal export facility in British Columbia.
10. To Revitalize Downtowns, Tax Land Speculation: Yes, something with the subtitle “5 reasons to love land-value taxes” was one of your most read articles of 2014. We’re proud to nerd out with the best of ’em.
9. 17 Things to Know About California’s Carbon Cap: The Northwest wants to make polluters pay, but Oregon and Washington don’t have to reinvent the wheel. California has already shown us some dos and don’ts in designing our own system.
8. The Man Behind the Exploding Oil Trains: How Warren Buffett has systematically worked to restrict safeguards on an oil train industry heavily backed by his Berkshire Hathaway conglomerate (…and why we *mostly jokingly* blame him and the team of hackers we presume he has for any time the Sightline computers act up).

Original Sightline Institute graphic, available under our free use policy.
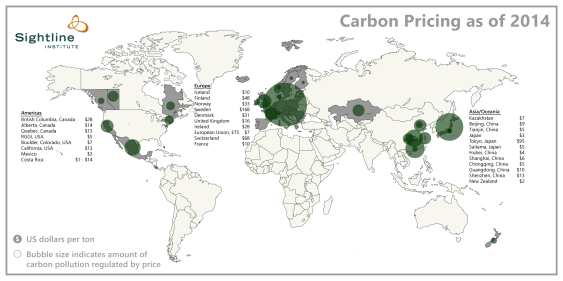
7. All the World’s Carbon Pricing Systems in One Animated Map: Kristin Eberhard somehow wrangled all the world’s various carbon pollution pricing systems worldwide into a nifty GIF. And how’s this for a reason to look forward to the new year?: when China’s national program starts in 2016, almost a quarter of global GHG pollution will carry a price tag to speed the changeover to clean energy.
6. All You Need to Know About BC’s Carbon Tax Shift in Five Charts: The kickoff to our “Cashing In Our Carbon” series, this article was picked up by Mother Jones, Atlantic Cities, Grist, Seattle P-I, and others. Six years into British Columbia’s best-in-class polluter-pay carbon tax, the revolution is looking pretty great.
5. Ebola versus Cars: As West Africa grappled with a real and devastating ebola outbreak, the American media over-hyped the risk to US residents. We couldn’t help but temper some of that with a chart comparing deaths from auto collisions with those from the virus.
4. Industry to Feds: “We Will Not Remove Any Unsafe Oil Rail Cars from Service”: Yep, that’s the oil train industry again! Eric crunched the numbers and summed up Big Oil’s own testimony at a March Senate hearing on oil train safety.
3. Washington State Traffic Forecast Finally Recognizes Reality: In what Clark Williams-Derry called “far and away the most responsible official traffic forecast I’ve seen from any government agency, ever” (!!!), the Washington State Office of Financial Management may have pushed over the first domino in ending the “build now, pay later” transportation planner’s mantra.

My bike, complete with a working kickstand, 24 fully functioning gears, and a trail-a-bike hitch. Image by Jennifer Langston
2. A Mom Rediscovers Her Bike: “I haven’t used a bike to get across town in six years. I know because that’s how long it’s been since I had a baby.” As part of her “Family-Friendly Cities” series, Jennifer Langston chronicled getting back on the ol’ two wheels and finding a vastly improved bike infrastructure for the casual urban rider—in large part thanks to neighborhood greenways.
1. Traffic on the Alaskan Way Viaduct Has Collapsed: As WSDOT and SDOT winced over Bertha’s delays and cost overruns, Clark found evidence in SDOT’s own records that traffic levels had collapsed on the Alaskan Way Viaduct since the tunnel construction began. The article made all the transportation circle rounds before SDOT retracted its previously published numbers. Still, WSDOT’s 2013 Traffic Report showed a considerable decline in SR-99 traffic.
Bonus: The wildly popular climate haiku, published last December, continued to draw a hefty audience this year. So (in case you missed it), we recently partnered with some friends to re-publish the set in Spanish. Share widely, por favor! They’re just as gorgeous as ever…


Ted Larkin
Thank you, Serena, for pulling together all the best of 2014. Very interesting and a great review.
Wonder if there is any pattern that can be recognized year over year over year? And, if so, I wonder further if those patterns might be of any instructional use for prioritizing Sightline proactive attention going forward?
Thanks for all your outstanding work.
Serena Larkin
Thanks, Dad! ; )
Yes, there are certainly patterns we observe among our readers, as informed by the annual audience survey, web traffic analysis, social media engagement, and newsletter use data. These stats, pulled on a monthly or weekly basis, help inform which segments of our audience need better outreach or which topics need more promotion.
Of course, as we noted in our audience survey, about half of our readers report having learned about Sightline Institute through a friend or colleague, so as much as we will always do our best to optimize our content for users and reach out to them, we also greatly depend on our readers to help spread the word about our work the old-fashioned, word-of-mouth way and put it to use in their own communities. So, I’ll take another opportunity to give a BIG THANKS to Sightline friends near and far for helping us broaden our reach and impact.