Here’s a look at the latest US Department of Energy figures in its quarterly coal export report, which take us up through the second quarter of 2014:

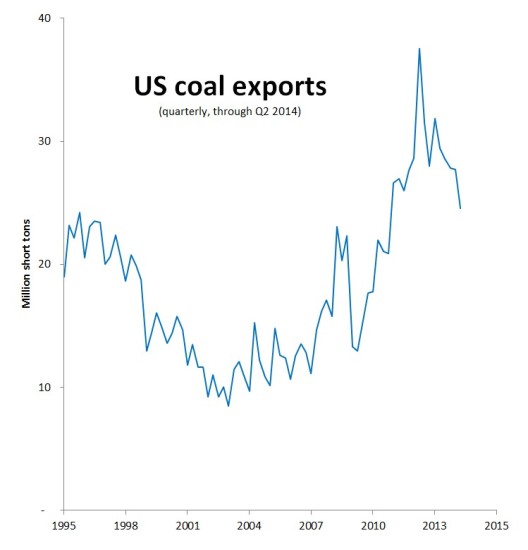
Nationally, coal exports fell again in the second quarter of 2014.
The US exported almost 24.6 million tons of coal in the second three months of the year. It was still a lot by historical standards, but it represented the fifth straight quarterly decline and a reduction of 35 percent from the industry’s high water mark in the second quarter of 2012.
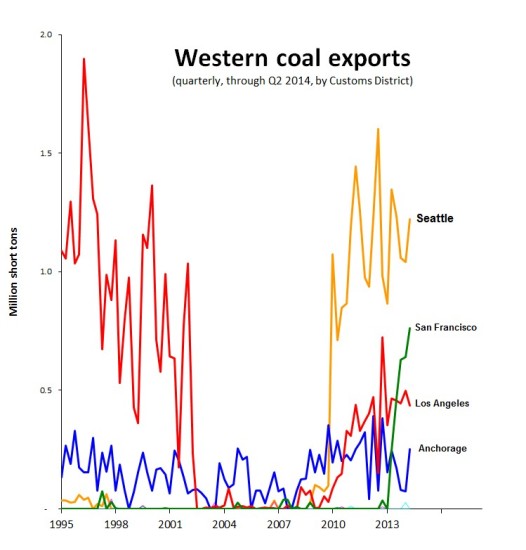
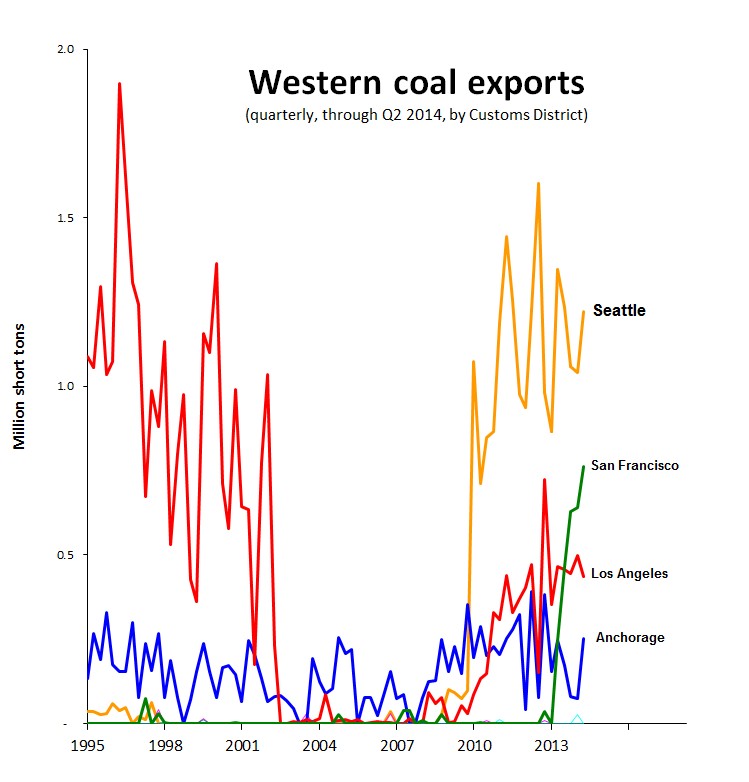
The Western Customs Region, center stage in the ferocious debate over expansion capacity, remains a minor player in the national coal exports scene, but once more coal shipments there increased a bit. The West Coast exported a little more than 2.6 million tons, 17 percent more than the previous quarter.

The Seattle District—where the data refer solely to coal traveling north from Washington into British Columbia for onward shipment to Asia—continues to play the biggest role in western coal exports. In this region, coal exports registered an increase to 1.2 million tons.
In its second quarter investment report, Cloud Peak Energy claimed responsibility for 1.0 million tons of coal exported to Asia by way of BC’s Westshore Terminal, implying that Cloud Peak coal accounts for the vast majority of the coal moving through Seattle en route to Canada for export.
The big coal export story in the west was in California where shipments out of the Los Angeles District (from LAXT at Long Beach) and San Francisco District (from the Port of Stockton and the Levin-Richmond Terminal) fell by 12 percent and 19 percent, respectively. By contrast, coal exports from the Anchorage District (referring to the Seward Coal Loading Facility) jumped back up to more than 250,000 tons.
Please note that there are serious questions about the accuracy of the official government coal export numbers. For more about these inconsistencies, see this post.
All figures in this post are given in short tons unless otherwise noted. All of my reporting on quarterly coal export volumes can be found in the series “Coal Export Trend Reports.” All data come from the US EIA’s latest quarterly coal report, covering the entire Western Customs Region. In addition to the districts shown on the chart here, the Western Region includes the Portland, Honolulu, Nogales, and San Diego Districts. These districts have been reporting virtually no coal exports. Please note that the second chart shows Customs Districts, not individual ports; the Port of Seattle does not move coal.
Thanks to Pam MacRae for research assistance.

