Many business owners and workers worry that carbon pricing will hurt local economies. They need to know: How would carbon pricing affect businesses and job creation in Washington and Oregon? In particular, how would it affect energy-intensive businesses that compete in national and international markets with companies not yet covered by carbon pricing? Will these energy-intensive, trade-exposed (EITE) businesses, like steel and aluminum manufacturing, still be able to compete with businesses outside the state or will carbon pricing send their sales plummeting? Will pricing carbon in the Northwest just send production and carbon pollution elsewhere? In other words, will carbon emissions “leak” to out-of-state firms?
The answer? Most businesses are not energy-intensive and consequently would be essentially unaffected; they might even benefit from carbon pricing if they receive offsetting reductions in existing taxes. However, a small group of energy-intensive businesses, only some of them trade-exposed, would be substantially affected by a price on carbon. Fortunately, there may be ways to partially and perhaps fully address those impacts, for example by reducing existing taxes on manufacturers.
In this article, I will spell out that answer, industry by industry, for Oregon and Washington. I assume a carbon price of $25 per ton of CO2. That figure is based on the proposal for Washington State that I’m working on with CarbonWA.org, and it’s close to the $30 carbon tax in BC. If you’re more interested in a California-style system, divide most of the carbon pricing financial impacts by two because permit prices there are roughly $12 per ton at the moment. For simplicity, I concentrate on CO2 from fossil fuels, which account for more than 75 percent of the total. A more-complete review would need to study more thoroughly the handful of industries with significant emissions of other greenhouse gases (GHGs) or of CO2 from other sources.
Who pays a price on carbon?
There are three ways to see that direct impacts of a carbon price on most businesses would be modest. The first approach is anecdotal: let’s consider a hypothetical energy-intensive business that spends 50 percent of its revenue on petroleum fuels. (That’s very roughly in the ballpark for an airline or a trucking company.) A carbon price of $25 per ton of CO2 works out to about 25 cents a gallon, so to keep the math simple let’s call that an extra 10 percent in fuel costs. Overall costs, then, increase by 5 percent. And since our hypothetical energy-intensive business sees a carbon pricing impact of only 5 percent, the vast majority of businesses—retailers, software companies, etc.—are going to see an impact that is much, much smaller.
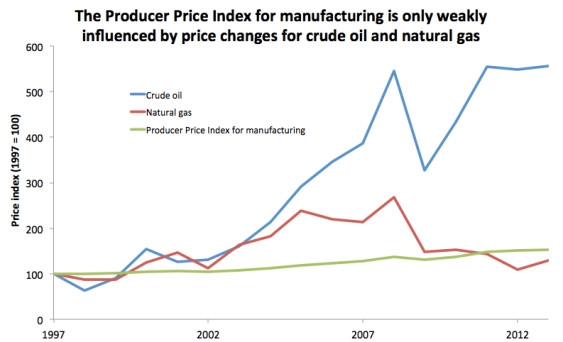
The second approach is to look at actual data from an energy-intensive sector of the economy—manufactured goods—and notice how stable prices have been despite the wild price changes in oil and natural gas over the past 15 years. The impacts of a $25 carbon price would be much less than these natural price swings, and if these natural price swings haven’t had a strong impact on the selling price of manufactured goods then it’s clear that the vast majority of businesses will not be greatly affected by a carbon price.
The third and final approach is to consider the data from the Carnegie Mellon Economic Input-Output Life Cycle Assessment (EIO-LCA) model, which breaks down the economy into 428 sectors and tracks the direct and indirect carbon emissions associated with each one. (The sectors are not of equal size: “retail trade” is one sector, and so is “power generation and supply,” and so is “tortilla manufacturing.”) The exact numbers from this model need to be treated with caution. For one thing, the model uses 2002 data and fossil fuel prices have changed since then. For another, national models like EIO-LCA don’t reflect the electricity mix in the Pacific Northwest. Still, the general results are informative.
Using the model, I estimate the impact of a $25 carbon price on each economic sector. Of the 428 sectors, only 2 (power generation and cement manufacturing) would see costs go up by an amount equal to more than 10 percent of revenue. Another 14 sectors would see a carbon price impact of 5-10 percent of revenue; examples include carbon black manufacturing, fertilizer manufacturing, and industrial gas manufacturing. The next 60 or so sectors—including pulp and paper mills, glass manufacturing, fishing, and air and truck transportation—would see a carbon price impact of 2.5-5 percent. The next 200 or so sectors would see a price impact of 1-2.5 percent; manufacturing still dominates this group, including most types of food and beverage manufacturing, but the group also includes various sectors of agriculture, forestry, mining, construction, and even a few unexpected sectors like colleges and universities. The final 150 or so sectors, with a price impact of less than 1 percent, include retail trade, software publishing, and high-value-added manufacturing such as aerospace.
A good summation comes from quoting “Who Pays a Price on Carbon?” a 2010 study of household and business impacts by economists Corbett Grainger and Charles Kolstad that uses an earlier version of the EOI-LCA model: “There are remarkably few sectors [of the economy] that see substantial cost increases.” They add that “what constitutes substantial is a subjective judgment” and I would add that whether businesses are trade-exposed matters here as well. A cost increase of (say) 3 percent is unlikely to significantly affect a business that will be able to raise its prices to compensate; the same cannot be said for a business that competes nationally or internationally, and consequently cannot raise prices, because that 3 percent will have to come out of the firm’s profit margin. (Typical profit margins for non-financial companies range from 5-10 percent according to investment advisor Jon Shayne. As another point of comparison, business and occupation [B&O] taxes in Washington State are 1.5 percent for most businesses and about 0.5 percent for manufacturing.)
Focusing on the Pacific Northwest
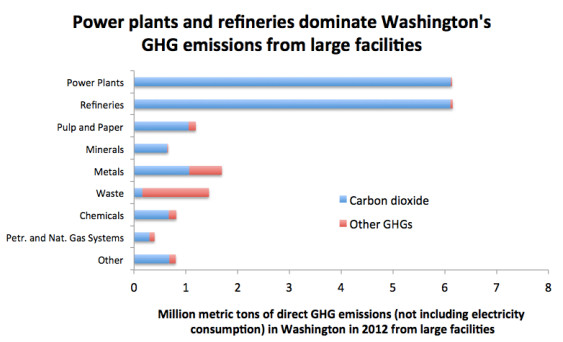
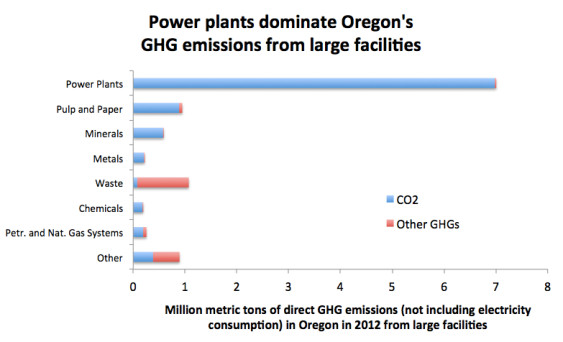
To bring these numbers down to the level of Washington and Oregon, consider EPA data on direct GHG emissions (not including electricity consumption) from large facilities, including all facilities that generate more than 25,000 tons of such emissions per year. For context, that level of emissions roughly equals the combined emissions of 1,000 households. In 2012, only 90 entities in Washington and 63 entities in Oregon made the cut for the EPA database.
Power plants and refineries
The dominant carbon polluters are power plants in Washington and Oregon and oil refineries in Washington. Each of those 3 sectors generates emissions of more than 6 million metric tons of CO2. At $25 per metric ton, pricing carbon would cost each sector more than $150 million.
That’s a lot of money, but remember that these are huge industries. For example, the Washington Research Council reports that the five oil refineries in Washington produced about 3.7 billion gallons of motor gasoline in 2011, plus a roughly equal amount of other products such as diesel and jet fuel. About half of their products are consumed in-state, including about 2.6 billion gallons of motor gasoline. Some $150 million in carbon pricing revenue divvied up among approximately 7.5 billion gallons of petroleum products is only about two pennies a gallon.
You might think that big industries like this would generate a lot of tax revenue for the state under the existing tax system. And you’d be right: the Washington Research Council estimates that the petroleum industry paid about $105 million in business and occupation (B&O) taxes and $163 million in other taxes, mostly the hazardous substance tax.
These existing taxes create an opportunity for a swap. Eliminate the B&O tax for refineries, and those $105 million in tax savings would be in the ballpark of the $150 million cost of a $25 carbon price. (Of course, the impact on individual companies would depend on their specific business practices and B&O tax liabilities, and since those are proprietary all we can do is express an interest in doing case studies on this topic. Also note that the Multiple Activities Tax Credit—under which refinery products sold in-state are subject to the B&O tax for selling rather than for manufacturing—may limit the tax savings to only about $60 million [figure 10.2])
A tax swap would give refineries a strong incentive to reduce emissions (every ton of reduced emissions would be $25 in savings) without greatly increasing their overall tax bill—or encouraging them to move production out of state. Besides, refineries may not be terribly exposed to trade competition anyway. No one has built a large refinery in the United States since 1977, and the two refineries in British Columbia—the Chevron refinery in Burnaby and the Husky refinery in Prince George—have not reduced their output since the province implemented its revenue-neutral $30 carbon tax. Likewise, Washington refineries have not cut output, even though the dollar value of B&O taxes paid by refineries has more than tripled since 2003 (Appendix A). The B&O tax is a tax on gross receipts, not profits, so if the price of crude oil goes way up then refineries pay much higher taxes, even if they’re not seeing any increase in profits.
Refineries in Washington or British Columbia may deserve tax reductions to offset the cost of a carbon price, but the purely economic case is tenuous.
Similar and additional questions about trade exposure arise with electric utilities. These businesses are regulated monopolies. They are subject to different types of economic pressures than most businesses. In any case, as with refineries, the $150 million carbon pricing bills for electric utilities in Washington and in Oregon should be seen in the context. For example, Washington’s largest electric utility, Puget Sound Energy (PSE), provided more than 22 million megawatt-hours of electricity in 2012 and had revenues of $2.2 billion. Based on PSE’s fuel mix disclosure reports, a $25 carbon price would cost the company about 1 cent per kilowatt-hour. That’s about a 10 percent increase of its retail prices.
If Washington chose to provide tax reductions to address the impact on electric utilities, it could trim the public utility tax, which utilities pay in lieu of B&O tax. The state’s Tax Reference Manual estimates that electricity providers pay about $225 million a year. Washington is roughly divided between public utilities like Seattle City Light that get a lot of hydropower and private utilities that are more carbon-intensive, so focusing just on the private utilities (because they are the ones that would be hit hard by a carbon price) would correspond to a public utility tax of about $100 million a year. As with refineries, that’s in the ballpark of that sector’s carbon pricing liabilities in Washington.
Opportunities for an electric utility tax swap in Oregon may be more limited. The relevant existing taxes in Oregon appear to be the corporate income tax and perhaps the electric cooperative tax, and according to the state’s Legislative Review Office (pages A7 and C21), utility tax payments totaled only about $3 million and $7 million, respectively, in 2010.
In any event, utilities are closely regulated by state utility commissions, and commissions will presumably allow utilities to pass carbon costs through to power consumers. Utilities, therefore, may not suffer in the least from a carbon price. (Consumers, for their part, could be compensated for power price increases with reductions in sales taxes, per-capita rebates, or other ideas discussed in two of the previous posts in this series.)
Other manufacturers
What about large emitters other than power plants and refineries? The EPA data show that emissions excluding these two industries totaled 7 million tons in Washington and 4.1 million tons in Oregon. At $25 per ton, that’s $175 million for Washington and $103 million for Oregon.
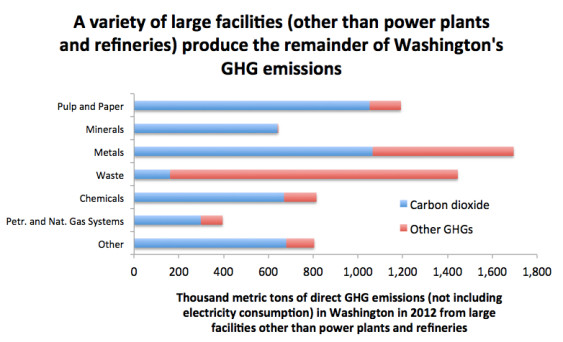
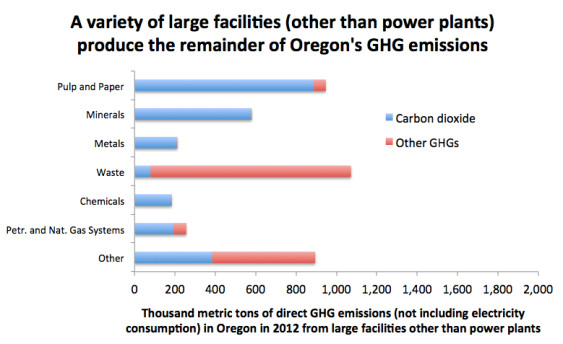
Carbon pricing liabilities in these sectors of the economy depend on the coverage details of the carbon price itself. The figures above reflect what might happen in a California-style system that covers most if not all GHG emissions. A BC-style system that just targets fossil fuels—or, to be more accurate, a large subset of fossil fuels—would not include the red (non- CO2) gases. And even the blue (CO2) bars in the figures overstate the actual impacts of a BC-style carbon tax because, for example, about half of the CO2 from cement production is from non-fossil-fuel-related chemical processes. For the sake of approximation, though, the blue bars shown in the figures above—only CO2 emissions, excluding power plants and refineries—total 4.6 million tons in Washington and 2.5 million tons in Oregon. At $25 per ton, that’s equal to a carbon pricing bill of $115 million in Washington and $63 million in Oregon.
How do these potential carbon pricing liabilities—on the order of $75-175 million in Washington and $40-100 million in Oregon, depending on the details of the policy—compare with existing taxes on manufacturers? In Oregon, the state Department of Revenue collected $49 million (page C21) in taxes from mining and manufacturing businesses in 2010. In Washington, the Department of Revenue estimates that manufacturing B&O taxes totaled $160 million in 2011. As noted, about $60 million of this came from refineries, leaving $100 million in B&O taxes for manufacturers other than power plants and refineries. In both states, then, existing taxes on large manufacturers are (in aggregate) in the ballpark of the additional direct cost of a $25 carbon price.
Beyond manufacturing
Moving beyond manufacturing entirely, the EIO-LCA model suggests that most other businesses would see a cost increase of less than 1 percent as a result of a $25 carbon price.
Moreover, in Washington State there’s a way to address carbon pricing impacts on many non-manufacturing businesses. I’ve argued previously that reducing the state sales tax by a penny (from 6.5 percent to 5.5 percent) is an excellent way to “recycle” carbon tax revenue, and that would benefit businesses as well as households. In fact, the state Department of Revenue estimates (table 9-3) that business purchases account for 36 percent of state sales tax revenue. The state sales tax generates more than $7 billion a year, so a 1-cent reduction would be $1.2 billion. More than $400 million of those tax reductions would accrue to businesses. [Update: A more recent DOR tally has businesses accounting for 32 percent of state sales tax revenues, so their share of the tax reductions would be $380 million.]
Let’s look at a specific example. Information from trucking companies is proprietary, but there’s a fairly similar entity that opens its books to the world: King County Metro. (You could argue that public transit systems should get an exemption from a carbon price, but never mind that for now.) According to its 2012 Annual Management Report (page 11), Metro uses about 10.6 million gallons of diesel fuel a year, so a $25 carbon price would work out to about $2.7 million a year. But Metro also spent $110 million on “transit fleet procurement” (that is, buses). And it pays state sales tax on those buses, so a 1 percentage point reduction in the sales tax would save it about $1 million, trimming Metro’s hypothetical carbon-pricing hit by 37 percent. That doesn’t entirely eliminate the impact of a hypothetical carbon tax, but it provides a substantial reduction. And most businesses are much less carbon-intensive than King County Metro.
The bottom line
When it comes to carbon pricing, the business world divides into three groups: businesses that are not energy-intensive, businesses that are energy-intensive but not trade-exposed, and businesses that are both energy-intensive and trade-exposed.
The first group includes the vast majority of businesses in Washington and Oregon. These businesses would pay relatively little in carbon pricing costs, and a reduction in sales taxes in Washington State would almost certainly offset costs for most of them. (If you’re especially concerned about small businesses, you could triple the small business B&O tax credit; that would save small businesses about $100 million a year.) Opportunities for a tax swap are less obvious in Oregon, but remember that the impacts of carbon pricing on businesses in Group One is quite small.
The second group consists of businesses that are energy-intensive but not trade-exposed. Refineries and power plants might fit this description, but let’s consider two less-energy-intensive examples that provide more clarity: local trucking and construction. Any company that wants to truck something around the Pacific Northwest or build something in the Pacific Northwest needs to conduct those business activities in the Pacific Northwest. All such companies would consequently pay the carbon prices associated with those business activities, and the laws of economics suggest that the market price of those business activities would increase accordingly. That’s all well and good because those business activities generate a lot of CO2: true-cost accounting means that those activities should be more expensive.
The third group consists of businesses that are both energy-intensive and trade-exposed, and the fact that they get an acronym (EITE) speaks to their importance. In an ideal world, there would be no businesses in this group: an ideal world would have an international carbon price instead of a state carbon price, and with an international carbon price all energy-intensive businesses would end up in Group Two. In the real world, however, states are leading the way on carbon pricing, and that obligates us to pay special attention to energy-intensive businesses that face out-of-state competition.
Fortunately, Washington and Oregon can reduce or eliminate impacts on EITE businesses by using about 10 percent of the revenue from carbon pricing to reduce or eliminate existing taxes on manufacturers. The relevant numbers may or may not balance for individual firms but in the aggregate they’re pretty close for a $25 carbon price. (And I’m looking for businesses that are willing to open their books and do a case study—anonymously if desired—-so if your business is interested please contact me!) That suggests that properly designed carbon pricing policies in the Pacific Northwest can pencil out for the business community and can help point the way forward for the nation and the world.
Research assistance by Summer Hanson. Thanks to Mia Reback and Jon Shayne for research guidance and to Quintin Barnes for feedback on a draft of this article.

