I’m old enough to remember the episode of The Simpsons when Homer Simpson, after 22 minutes of serial idiocy, wraps up the show by proudly declaring: “Marge, my friend, I haven’t learned a thing.”
Well, it seems that BC’s transportation officials are now treating The Simpsons as an instruction manual.
As I pointed out a few months back, British Columbia’s transportation planners have long been nursing a delusion that traffic across the Port Mann bridge will magically start to soar any day now…even though actual travel across the span has trended downward for the better part of a decade.
And they’ve apparently done it again:
There are 5,000 to 6,000 fewer cars a day on the bridge, compared to traffic prior to the toll being introduced a year ago, said Todd Stone…”But we expect is that those numbers will bounce back as people really sort it out, and determine: how much is their time worth?”
Revenue forecasts for the next three years are being adjusted to 20 per cent lower than first anticipated: to $144 million for fiscal 2014, $159 million for 2015 and $174 million for 2016.
So revenue is down by 20 percent…but still projected to rise rapidly in the next few years!
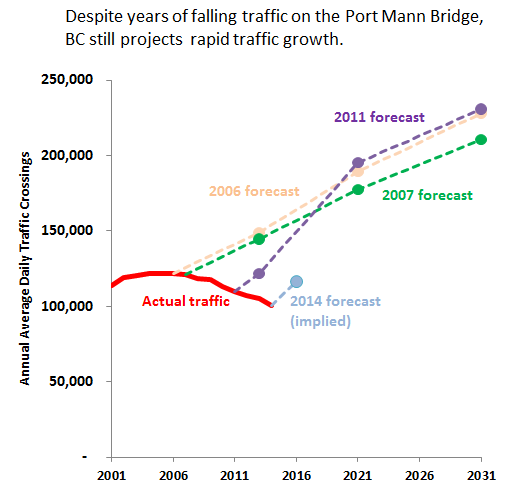
I have yet to see the official traffic forecasts underlying those revenue projections. But I think it’s a pretty safe assumption that they’re projecting that revenue will rise in step with traffic volumes. Port Mann tolls don’t vary with the time of day—a car pays $3 to cross the span, whether it’s at rush hour or the dead of night. And tolls are slated to rise only at the pace of inflation, capped at 2.5 percent. Reverse-engineering the traffic forecasts, along with estimates of traffic trends over the past two years, I get this chart:
 Just to be clear, the light blue dotted line may not be perfectly accurate. I haven’t accounted for changes in the mix of motorcycles and heavy trucks, or any shifts in enforcement or other toll revenue. Nor do I know what inflation rate the province is expecting. (I plugged in 2 percent into my estimates.)
Still, I bet that the blue line is pretty close. And if it is, it reveals something truly remarkable: rather than adjusting their their forecasts to match reality, BC’s transportation officials doubled down on projections that have repeatedly been proven wrong.
Marge, they haven’t learned a thing.

Comments are closed.