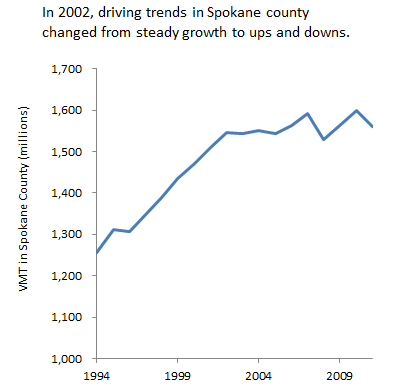
 As we mentioned a few weeks back, traffic in eastern Washington has been pretty stable for the past decade—suggesting that the flattening of traffic growth isn’t just a big-city phenomenon.
But the eastern Washington figures were dominated by Spokane—which isn’t a big city, but isn’t a small one either. So what’s going on with traffic volumes in Spokane? As the chart to the right shows, Spokane follows a trend that’s fairly similar to the state overall: steady growth through the early 2000s, followed by a bumpy plateau.
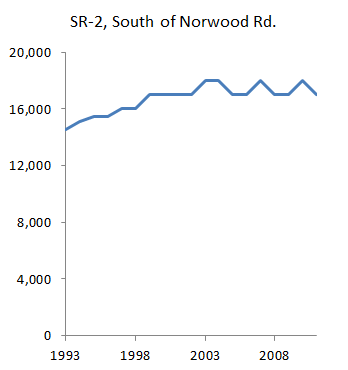
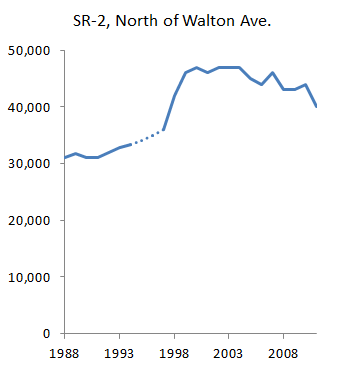
The state maintains a handful of permanent traffic counters in the county, and the trends on the county’s major roads look somewhat like the trend for the county overall. Here are annual traffic volumes at two sites on SR-2:
The second of those two SR-2 charts strikes me as a little odd: why did traffic volumes shoot up so quickly in the late 1990s? (And as a note: the dotted lines represent missing data.)
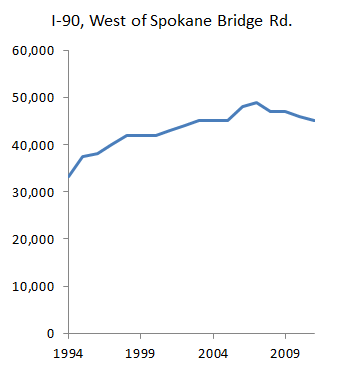
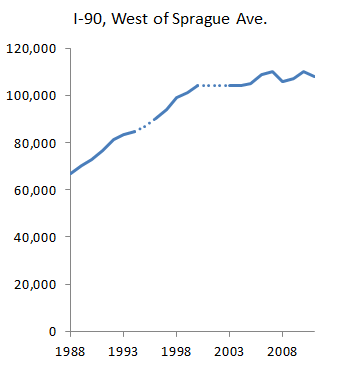
And here are trends at two spots on I-90:
Looking at the broad contours of the trends on these roads, they generally tell a story that’s consistent with the trends for the county as a whole: steady growth, followed by a leveling off. So it looks like Spokane County is yet another place where traffic growth, both in the big picture and on particular road segments, simply isn’t keeping pace with expectations.

Comments are closed.