A little while back, we took a look at commuting in Seattle vs. Portland—and found, perhaps unexpectedly, that Seattle had a heck of a lot more transit commuting than Portland.
But that comparison only looked at work trips, and only trips within the city limits of Portland and Seattle. So what about the metro areas as a whole—and transit for all trips, not just trips to work?? The National Transit Database offers some clues…and as it turns out, for total transit ridership the Portland metro area may edge out greater Seattle.
But neither Portland nor Seattle can hold a candle to greater Vancouver, BC.
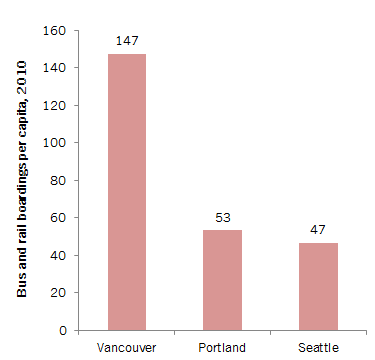
The simplest comparison among the three cities looks at the average number of bus and rail transit boardings per person, per year, in the entire metro area. And on that measure, Vancouver vastly outstrips its two southern neighbors.

Unfortunately, the story is somewhat more complicated than this chart suggests. Vancouver’s transit system encourages transfers—and since there’s a single, unified transit agency for metro Vancouver, there’s good data on how many riders actually transfer in the course of a single trip. Seattle, in contrast, has so many overlapping transit systems that it’s very difficult to assess how many transfers there really are.
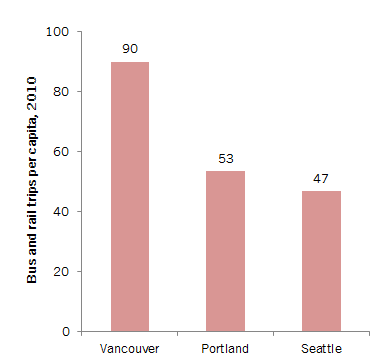
Still, even if you assume that each transit boarding in Portland and Seattle represents a single trip, but use Vancouver’s data on “trips” rather than “vehicle boardings,” Metro Vancouver still beats the two US cities handily:
Using the same “trip” definitions in the chart above, a mode-by-mode breakdown shows that Portland has far more rail riders than Seattle, while greater Seattle edges out greater Portland in bus ridership. But Vancouver still comes out on top in both categories.
| Trips per capita, 2010* | |||
| Vancouver | Portland | Seattle | |
| Bus | 56 | 32 | 43 |
| Light Rail | 33 | 21 | 3 |
| Commuter Rail | 1 | 0 | 1 |
*Note: Vancouver data represent transit “trips”, while data for both Portland and Seattle represent transit “boardings.”
Of course, there’s still more to the story. These charts exclude a number of transit modes, including dial-a-ride transit (which is typically door-to-door service offered to those who are physically unable to use standard transit service), as well as vanpools and ferries. I’ve decided to keep those out of the analysis for now, but I’ll note that after including ferry trips in the total trip count, Seattle’s per capita transit ridership ties Portland’s; and when you add in vanpools as well as ferries, Seattle narrowly edges Portland.
So perhaps Portland and Seattle are about tied…but tied in a race to see who comes in a distant second to Vancouver.
Notes and Caveats:
For this analysis, we considered all of the transit agencies in the greater Portland and Seattle metropolitan areas, as listed in the National Transit Database. For Seattle, those agencies included King County Metro, Sound Transit, Community Transit (in Snohomish County), Everett Transit, Pierce Transit, the City of Seattle, and a handful of ferry providers—but not Kitsap Transit. For Portland, it included Trimet, C-Tran in Clark County, the South Metro Area Regional Transit agency in Wilsonville, and the Metro vanpool program. All data for Metro Vancouver comes from Translink. In Seattle, light rail includes the monorail and South Lake Union Trolley, as well as Sound Transit’s Link Light Rail. Population for the Seattle metro area includes the full population of King, Snohomish, and Pierce counties. Greater Portland’s population includes Clackamas, Multnomah, and Washington counties in Oregon plus Clark County, Washington. Population for greater Vancouver includes all of Metro Vancouver. Note that Seattle and Portland population totals, as described above, may differ from the populations of the service areas as defined in the National Transit Database.


Comments are closed.