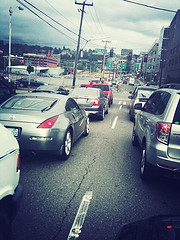
There they go again. First, the Texas Transportation Institute came out with its urban congestion rankings. Then it was traffic firm INRIX’s turn. Now, TomTom, which makes in-car navigation systems, has its own urban congestion rankings. And as the Seattle Times pointed out yesterday, TomTom’s methods rank Seattle as having the continent’s fourth-worst congestion. Meanwhile, Vancouver, BC, ranks #2 on the continent, second only to LA.
But TomTom’s methods have the exact same flaw that economist Joe Cortright has pointed out in the other reports: their measure of congestion looks only at car speeds, not at total travel time for people. In fact, compact cities with short commutes can actually get penalized in these rankings!
To explain how TomTom’s ranking can penalize cities with short commutes, let’s imagine two metropolises: Compact City, where car commuters don’t have to travel too far during their daily commute; and Sprawlville, which is more spread out. In Compact City, congestion boosts the average commute from 20 minutes to 25 minutes—a five minute delay, adding up to a 25 percent congestion “penalty”. In Sprawlville, a typical 30 minute commute is lengthened to 35 minutes by congestion—also a five minute delay, but a congestion penalty of only 17 percent.
Both cities have the exact same congestion delay, and residents of Compact City actually spend less time behind the wheel during rush hour. Even so, TomTom’s methods (just like those of INRIX and TTI) would rank Sprawlville as having far less “congestion” than Compact City.
TomTom’s congestion index also leaves out the experiences of people who walk, bike, or take transit. In Seattle that’s over 30 percent of commuters, in Portland 22 percent and Vancouver (BC) 42 percent. Some of these commuters are affected by congestion, but some aren’t—and regardless, they’re effectively invisible in TomTom’s rankings.
All of this is to say that comparing cities’ “congestion rankings” can obscure more than it reveals. No matter how sophisticated the data that is used to generate them, the methods remain flawed—and at least somewhat divorced from people’s actual experience getting around town.


Comments are closed.