There’s much to recommend in Washington’s state energy strategy, but the most arresting element is one that doesn’t get much attention: almost half of all the energy in Washington is wasted.
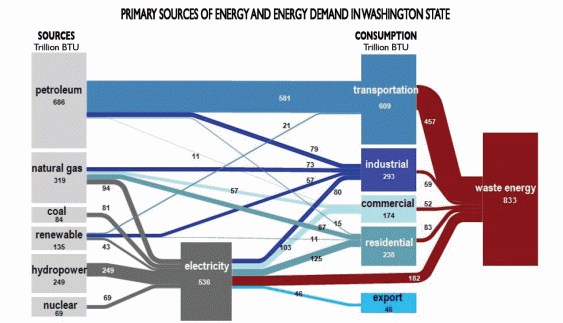
That may sound preposterous, but in fact it’s an understatement. To understand what’s going on, feast your eyes on this graphic:
[Click the image for a bigger version.]
This is a picture of Washington’s energy system. On the left in gray are the primary energy sources used by the state in 2009—oil, gas, coal, nuclear, hydro, and other renewables. Of the 1,543 trillion BTUs used to produce energy, 536 were used to generate electricity. But more than one-third of the energy used to generate electricity was wasted, mostly as unused exhaust from boilers and combustion turbines but also a bit from transmission wires.
Yet the electric sector, wasteful as it is, is actually pretty efficient relative to some of the end-use sectors like transportation, shown in blue.
Consider: the state burned through 609 trillion BTUs of energy, almost entirely petroleum-based, to move cars, trucks, trains, planes, and boats. But fully three-quarters of the energy used to power our vehicles was wasted. As the report explains:
The vast majority of energy used is never applied to moving vehicles and ends up being lost as waste heat. The primary reason for that loss is that the majority of vehicles in use are direct-drive internal combustion engines, which deliver, on average, barely 25 percent of the energy in the fuel to the wheels on the road.
Transportation energy is particularly problematic. It may amount to only one-third of the state’s total energy usage, but it accounts for 45 percent of Washington’s greenhouse gas emissions (even counting non-energy ghgs) and 60 percent of its energy expenditures. Virtually all transportation energy is oil-based and Washington produces no oil, which means that the vast majority of that expenditure is leaving the state. And the notorious volatililty of oil prices means that more than half the state’s energy expenditures are unpredictable and economically risky.
The other end-use sectors—industrial, commercial, and residential—consumed 705 trillion BTUs in aggregate, but wasted about 28 percent of that. If that sounds pretty good, it’s not. It’s terrible. That 28 percent waste figure covers only equipment inefficiency; it doesn’t account for heat loss from poorly insulated buildings, inefficient building design, or poor building management like heating unused rooms or leaving the lights on. If those other forms of waste were tallied, the true waste from these sectors would be much, much higher.
What does it all add up to? Colossal waste. Excluding energy exports, Washington wastes 45 percent of the energy used in transportation, buildings, industry, and electricity generation. Factor out the complications of the electric sector, and the state is wasting 50 percent of the energy it consumes. (Again, not including wasteful practices or inefficiently constructed buildings.)
This isn’t just a waste of natural resources and carbon, it’s a huge waste of money. Energy isn’t exactly free, and particularly not in a state that can supply none of its own oil, coal, or natural gas—fossil fuels that Washington spends roughly $16 billion annually to import.
Wasting half of our energy is an ongoing economic drain. In fact, if a person wanted to improve the state’s economy, it’s hard to think of a better strategy than cutting energy waste.
Uncle Vinny
ACK! What’s the scale on that chart? It seems like it’s a mishmash of different scales. I love the idea and the post, but the skewedness is driving me crazy.
Eric de Place
Hmm, I can see how that’s confusing looking, but as near as I can tell it’s all on the same scale.
Each of the columnar blocks is sized according to the number of BTUs it represents. If you look at the top two gray boxes on the left for example, you’ll see that the 686 tBTUs for petroleum is about twice as big as the 319 tBTUs for natural gas.
It’s the same story for the connecting lines. Their width is proportional to the volumes they represent. Thus, the 581 tBTUs of petroleum that’s used in the transportation sector (top fat blue line) is roughly 7 times wider than the 79 tBTUs of petroleum that flows to industrial uses (darker blue line just below).
Make sense?
Uncle Vinny
Well… OK. I guess that makes sense. But it’s disorienting for my little tiny brain.
Alan Durning
As you note, these estimates understate the full scale of waste. In a typical car, for example, one 1 or 2 percent of the energy in the fuel ends up propelling the driver and passengers forward. The rest is lost to wind resistance, heat in the engine or tires, or to moving the enormous weight of the vehicle itself. In thermodynamic terms, the bicycle is a near-miracle in its efficiency. The energy in my morning bowl of cereal is quite efficiently transmitted through my legs into my body’s forward motion.
Reena Meijer Drees
As you point out, the waste energy in this diagram represents the built-in (in)efficiency of the existing infrastructure: the inherent efficiency of the combustion engine, for instance, or the efficiency of electrical transmission lines. These efficiencies are very, very difficult to improve by more than, say, 10%, and any improvements that are made take years to roll out. So while you can marvel at the crappy job we do, it’s far from obvious how to make it better.
I think what this figure really illustrates is that our current model is inherently extremely wasteful, and that no amount of tinkering is going to fix it. It illustrates just how much energy we spend on transportation. It clearly illustrates that as petroleum gets more expensive (as it will), the transportation sector will get hit, big time.
Given climate change and peak oil, this figure shows pretty clearly which particular industry segment needs to be completely reconfigured…
Stacey W-H
One innovative way to get at that transportation waste, as well as the other thermal losses shown in the chart, is through a combination of district energy systems, combined heat and power systems and electricity-based transportation. A district energy/CHP system with a network of boilers and generators captures the heat, currently lost to the atmosphere, and puts it to use offsetting heating and cooling energy use in buildings and for industrial processes. It can also generate power for use in electric vehicles. Such a system takes the waste heat from all the internal combustion engines in vehicles and moves that heat upstream to highly efficient boilers and combined heat and power systems which can capture the heat and put it to use.
It won’t work everywhere, but where it does, the energy efficiency is about 80%. The boilers can also be fueled by urban wood waste, agricultural residues, solar hot water and other potentially renewable fuels. Check out what Wikipedia has to say: http://en.wikipedia.org/wiki/District_heating
Alex
I like what you’re saying Eric, but it seems like “waste” is an incredibly loaded term in your article and the state’s statistics. For example, if direct-drive internal combustion engines are the only option for most people, couldn’t the waste from motor vehicles be calculated relative to current, reasonable alternatives? I’d be curious to hear if there are reasonable ways for power companies to reduce unused exhaust from boilers and combustion turbines. Are solutions coming in another post?
Tim Nuse
What about the electricity generated to meet the assumed demand of the moment? Aren’t our public utilties estimating our demand and using near real-time data to adjust these estimates up and down? And doesn’t that mean we are ultimately always producing more energy then end-users actually use? How is that reflected in this graphic? I know… lot’s of questions. Great work, Eric.
Morgan
I agree with the perspectives Reena and Alex offer. The situation is technologically whacked, but the path to alternatives is complicated, to say the least.
The economist in me immediately asks what is the cost to getting us to an exponentially more efficient system? Apparently, it’s too high, and it’s ‘cheaper’ to ‘waste’ certain resources than to spend other resources on a transition. The barrier to entry is just to high, and we’re stuck with incrementalism.
It’s peculiar (okay it’s frustrating) how we can be in a place where the integral of future benefits crushes the cost of transition like Godzilla stomping on those little houses, but we (“they”) always find a way to support the current paradigm.
Part of me is hoping that interest rates will stay low for a long time so that the value of future benefits can have meaningful weight in today’s decision making, like this situation.
Morgan
Variable insurance is mentioned in the report. Yeah!
Morgan
Eric, I just read the transportation section, a policy area I’m familar with, and there’s a ton of good policy recommendations in there. I suspect the same is true of the other sections.
I didn’t see anything new, but I’m interested in how we can put legs to these ideas.
Still, the frame of waste is a good one when decision makers have all drawn their swords looking to cut programs.
Scott Walker
I too read that disappointing report and felt our “representatives”, who wrote the recommended strategy, were not offering a strategy that honestly dealt with the 40% of GHG from transportation. Almost the entire focus was on transitioning to an electricity powered personal vehicle fleet, which will continue to keep us all pouring money into the auto industry and asphalt lobby. It will, as well, ensure that the public support expanding nuclear powered electricity generation. The HUGE omission in the report was the non-mention of the role a 1st class transit system could play in reducing our energy consumption, reducing VMT’s, reducing GHG’s, reducing impervious surface, reducing polluted runoff, reducing sprawl, etc. If the report is the best our state can do, tinkering with increments, we are truly screwed. Please tell me I missed something.
Scott
Scott Walker
On re-reading my comment, I see that an electricity based transportation vehicle does reduce GHG’s, but do we really want to marry ourselves to a nuclear future when there is a viable alternative? Besides GHG, all the other issues of a personal auto system are still unsolved with an electric based one.
Scott
Frequent Poster
Okay, so exploding petroleum in small chambers and using it to drive pistons and a crankshaft isn’t all the efficient. Neither is a solar panel, which converts only 25% of the available photons to electrons.
To call this “waste,” while accurate in a linguistic sense, is misleading, because in common usage “waste” implies sloth, when (at least in this article) you haven’t demonstrated any.
Tell me, what alternative will “waste” less energy? I’m a big fan, at least in theory, of electric vehicles. But they’re still a niche, given the issues of driving range, battery longevity, and those pesky rare earths that are a necessary component of their manufacture.
If your intent is to make me or anyone else feel guilty for not taking the bus or a bike everywhere, you’ve failed. And like I say, I’m a fan of electric cars, photovolatic panels, windmills, and (to save the most effective, least glamorous, and therefore and most commonly overlooked for last) ground-source heat pumps.
But please, don’t try to sit there and, by implication (and don’t bother denying what I’m about to say, ’cause you won’t be fooling anyone with that What? Me? schtick) telling people who drive a care that they’re a fat, nasty earth-killing pig. It’s like trying to turn us into vegans. All we’ll do is laugh at you.
If you want to move the ball forward, compare the alternatives in the real world, accepting life as we live it. You’ll get further that way. Honest.
Eric de Place
I very much appreciate a robust dialogue with folks who don’t agree with me, but let’s keep it civil.
I can assure you that I’m definitely not, to use your words, “…telling people who drive a care [sic] that they’re a fat, nasty earth-killing pig.” There’s no need for that. In point of fact, I own and drive a car, just like most people in the Northwest.