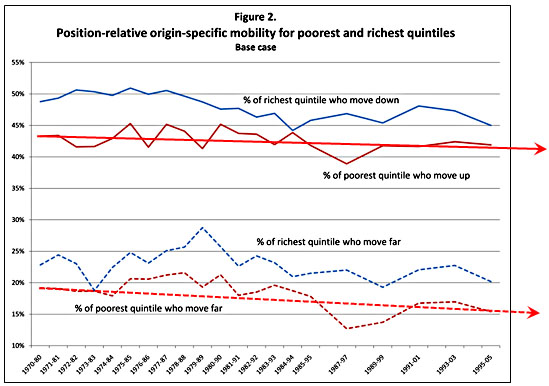
First, via Kevin Drum, a new paper from the Boston Federal Reserve on family income mobility. The paper takes a rigorous quantitative approach to demonstrate that there is an increasing ossification in income classes. The rich are more likely to stay rich and the poor are more likely to stay poor.
I won’t even try to improve on Kevin Drum’s analysis:
The study tracks the income of families over a ten-year period, and includes only families that were both independent (i.e., not living with their parents) and not retired for each ten-year period under study. Income is also adjusted for family size. Putting this study together with everything else we know, we can see a grand total of four things happening during the 35-year period from 1970 to 2005:
- Income inequality is increasing: the rich are much, much richer today than they used to be.
- To deal with this, tax rates on the rich have gone down.
- Income mobility is decreasing. If you start out poor or middle class, you’re more likely to stay there than in the past.
- To deal with this, government assistance to the poor has gone down.
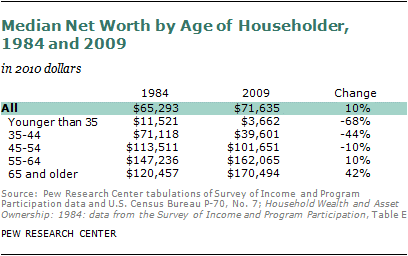
Second, the Pew Research Center produced an alarming new study, “The Rising Age Gap in Economic Well-Being,” finding that older households have made dramatic economic gains relative to younger households.
This is, basically, a picture of an economy that is freezing out the so-called “Millennial” generation. With few toeholds for employment or advancement, it’s hard to imagine a worse time to be entering the labor market.
Not that their older generational siblings are doing any better. Pew’s figures also reveal that the bursting of the housing bubble and ensuing recession was devastating to the net worth of Generation X households.
Older generations emerged basically unscathed.
The Pew report also finds shocking increases in the poverty rate among those younger than 35—rising from 12 to 22 percent since 1967—while the poverty rate over 65 has declined massively—from 33 to 11 percent—over the same period.
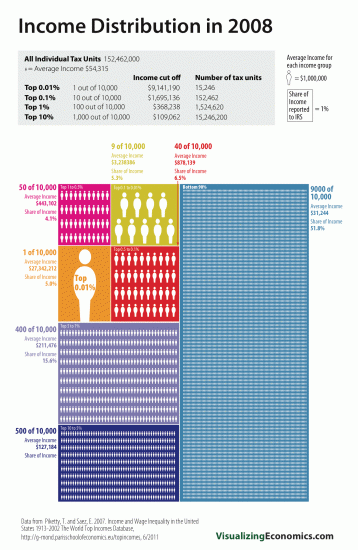
Finally, Visualizing Economics has a terrific depiction of income ownership based on research from Piketty and Saez:
Needless to say, the trends I’ve mentioned here are interwoven and can mutually reinforce one another. For example, widening overall income disparities are reflected in the wealth gap between older and younger generations because the one-percenters are overwhelmingly older. Just so, the generational wealth gap contributes to income immobility as well-off families are able to provide for economic opportunities that will remain out of reach for lower-income families.


Comments are closed.