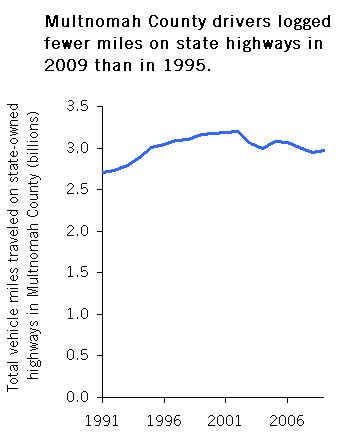
 Continuing my obsession with flat-lining traffic trends, here’s a chart showing that drivers in Multnomah County—Oregon’s most populous county, and home to Portland—logged fewer miles on state-owned highways in 2009 than they did in 1995. Traffic volumes on those roads hit their all-time peak in 2002.
The numbers all come from the Oregon DOT website (here’s a link to the actual spreadsheet with county-level VMT figures).
What puzzles me is: why aren’t the facts about flat traffic trends more widely known? It’s not like they’re particularly new; throughout the northwest, traffic growth has been defying predictions for well over a decade. Yet still, many folks who ought to know the trends are disinclined to believe them.
For example, one of the most common reactions (including an unflattering comment by an Oregonian reporter) to our report last month on Peak Gas—which showed that gasoline consumption in Oregon and Washington flattened out in 1999—was that the trend was largely caused by gains in the fuel efficiency of cars and trucks.
The thing is, that’s not actually true.
For much of the period of “peak gas,” the light-duty vehicle fleet was actually getting less efficient. Through the mid-2000s, the auto industry was focusing its technology improvements on increasing horsepower, not improving fuel efficiency. Meanwhile, sales of SUVs, minivans, and pickup trucks were gradually edging out cars. Between these two trends, the fuel efficiency of new light-duty vehicles fell fairly steadily from 1987 all the way through 2004. It was only in 2007 or so, after SUV sales had cooled a bit, that the average new vehicle was as efficient as the one it was replacing. (See this Department of Energy spreadsheet for details.)
So saying that a decade’s worth of flat gas consumption was due to improving vehicle efficiency is simply an error: the trend included a long period of declining average mpg, and a shorter period, particularly after 2008, when the average mpg of the vehicle fleet improved. For the most part, the trend of flat-lining gas consumption is explained by the flat-lining in state-wide VMT.
To me, what this points out is the danger of relying on intuition and hearsay instead of hard data. Intuition says that we’re driving more than ever, so any declines in gas consumption must be due to more efficient vehicles. Reality, however, tells a different story: person for person, we’re driving less; total vehicle travel is holding roughly steady; and the gains in vehicle efficiency have been real, but more modest and more recent than you might think.

Comments are closed.