A few months back, the transportation consulting firm NelsonNygaard released a fascinating report that looked at what might happen to downtown Seattle traffic patterns if the state builds a tunnel through downtown, while imposing a steep toll on drivers who choose to take it. (We’ve already written about that report once before.)
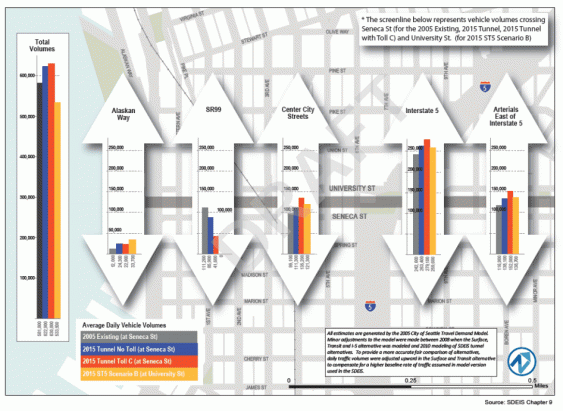
Below, for your viewing pleasure, is the most important image from that report. Click it to see a larger version — and I’ll explain what it means in a moment.

There’s a lot of information in the chart, but you can ignore much of it. The only thing I want you to pay attention to are the orange and yellow bars:
- The dark orange bars represent the state’s projections for 2015 traffic volumes under the most likely deep bore tunnel scenario, in which drivers would pay $5.00 to use the tunnel during the afternoon rush hour.
- The yellow bars represent traffic volumes under the “ST5” or “Streets, Transit, and I-5” plan, using the same traffic model but with some different inputs. Under the ST5 plan, the city and state would make substantial investments in transit and “transportation demand management” to reduce traffic volumes, and also make improvements to city streets and I-5 to help improve traffic flows.
The first thing to notice is that the ST5 plan results in lower overall traffic volumes. (Those are the tallest bars to the left; the yellow ST5 bars are lower than the orange tolled tunnel ones.) If you care about greenhouse gas emissions from Seattle’s traffic, this is certainly an important thing to pay attention to.
But the second thing to notice is the length of the orange and yellow bars for center city streets, I-5, and arterials east of I-5. For all those three corridors, the orange bars are all longer than the yellow bars. And what that means is simple: the state’s own traffic models are projecting that a tolled deep-bore tunnel creates worse traffic downtown and on I-5 than the streets-and-transit plan.
It’s simply devastating news for the deep-bore tunnel, because it means that the city and state are predicting that a multi-billion dollar tolled tunnel would actually make downtown gridlock worse.
How is that even possible?
Well, the ST5 plan has several elements that encourage alternatives to cars, by investing in transit and proven transportation demand management strategies. But the tunnel has no such investments; and worse, it envisions tolls that are so steep—$9 per day for a rush-hour round trip—that the models predict that many drivers will simply avoid the tolls by taking to city streets and I-5.
This point is so damning that I’m sure that someone will claim that the numbers are being cooked. But they’re all official sources, from transportation model runs conducted or authorized by the city and state. The estimated 2015 traffic volumes for the tolled tunnel come from the state’s projections based on the Puget Sound’s transportation demand model; see exhibits 9-11, 9-12, and 9-13 in Chapter 9 of the Alaskan Way Viaduct SDEIS. The numbers for ST5 come from a different run of the exact same transportation demand model, but with slightly different inputs. That model run was prepared for the Alaskan Way Viaduct stakeholder advisory committee, but the consulting firm NelsonNygaard adjusted them upwards (that is, in a direction less favorable to the ST5 plan) to make them more directly comparable to the figures from the SDEIS.
It’s also worth taking a look at Figure 4.7, which shows the projections for 2030.


Even in 2030, the state is projecting that traffic on “city streets” — the second-darkest bar — will be worse with a tunnel than without one: 115,000 cars per day under ST5, and 131,000 cars per day under the most likely tolling system (Scenario C). [Note, I slightly edited the paragraph above, based on a helpful suggestion in the comments. I’m talking specifically about the “city streets” section of the bar above.]
This, of course, puts a whole new spin on the ads that are running on blogs around town—suggesting if you’re “sick of gridlock” you should “move forward” by voting to build a tunnel. Perhaps the folks behind the ads should take the time to read the state’s own traffic forecasts.

Comments are closed.