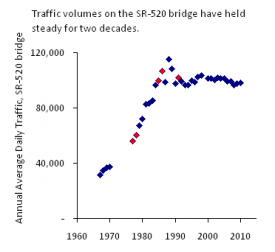
Well, this is the weirdest of our whole series on traffic trends: the number of cars and trucks crossing the SR-520 bridge across Lake Washington has held steady for…wait for it…more than 20 years. It was hard for me to believe at first, but it’s the only conclusion you can reach from the state’s Annual Traffic Report series.
 In the chart to the right, the red points were marked as “estimates” by WSDOT. The blue dots were the state’s direct counts of actual traffic volumes, averaged over the year. I have no idea how to explain the spike in the late 1980s. [Update: looking at the original pdfs, that spike appears to be an error; WSDOT’s numbers for 1988 through 1992 show several serious anomalies. Also the spike occurred when the state was switching methods of counting traffic volumes on 520, moving from axle counts to vehicle counts.] But the astonishing fact is that average daily traffic volumes on the SR-520 bridge were about the same in 2010 as in 1985. And traffic volumes have held roughly constant—with a few modest ups and downs—since 1990.
Given what’s happened over the last few decades, it seems like a pretty safe assumption that if the bridge remained in its current configuration, traffic volumes would continue to hold steady, rather than climbing inexorably upwards.
And yet, the state’s transportation models—the ones used to justify a project to widen the bridge—show that traffic volumes on the SR-520 bridge are going to go up, starting soon. Take a look at Exhibits 5.1-1, 5.1-2, and 5.1-3, in Chapter 5 of the state’s SR-520 SDEIS. It shows that the state is predicting that traffic throughput on the bridge will grow between now and 2030. Yet those predictions of ever-increasing traffic seem to be directly at odds with the fact that SR-520 traffic volumes in 2010 were five percent below what they were in 1998—the most recent peak.
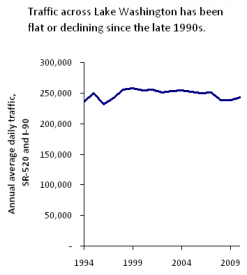
 The traffic trends don’t change much when you throw I-90 into the mix. Traffic on I-90 across Lake Washington has remained roughly flat since 1998. So as the chart to the right shows, total traffic volumes across the two spans combined have remained steady for about 13 years. If anything, traffic is a bit lighter now than it was a decade ago!
This is a set of facts that the standard traffic models used in the Puget Sound have a terrible time explaining. Those models tend to assume that more people and more money in a metropolitan area mean more traffic, everywhere. But over the past decade, population and the economy have both expanded—and yet traffic volumes on one of the region’s biggest highway corridors have remained flat.
The stark contrast between actual traffic trends across Lake Washington and the state’s forecasts of increasing traffic volumes leads me to a simple conclusion: the state’s transportation models aren’t based in reality. Essentially, those models treat the growth in traffic volumes as a core, unassailable assumption—even though it’s often at odds with the observable facts. Compounding the problem, the public debate over highway mega-projects tends to treat the transportation models’ predictions about future traffic growth as facts — as inescapable conclusions of a rigorous scientific process—rather than as shaky assumptions that often conflict with actual traffic trends.
And that core mistake—confusing assumptions for facts—can make billion-dollar highway projects seem like a necessity rather than a costly luxury.
[Kudos to Sightline staffer Pam MacRae, who compiled the data from the state’s annual traffic reports. And note that the post has been edited slightly after it was first posted; and just to be clear, I am interpreting the the SDEIS projections for “Vehicle Demand” to mean “Average Daily Traffic” — that is, that “demand” should be interpreted to mean actual traffic volumes. The SDEIS is written a bit unclearly; I think this is the accurate interpretation, but f I’m wrong, please correct me in comments!]

Comments are closed.