*** Please also see this detailed city-by-city ranking of commute behavior ***
I can’t resist fiddling with the big batch of new Census data. So here’s a look at commute habits in Northwest cities, rank-ordered by the least share of workers driving alone:

This was quite a surprise to me. Generally speaking, I think of Seattle and Portland as being virtually identical in this sort of ranking. But the reality is that Seattle is the Northwest’s clear leader in commute-trip alternatives with fewer than 53 percent of workers driving solo.
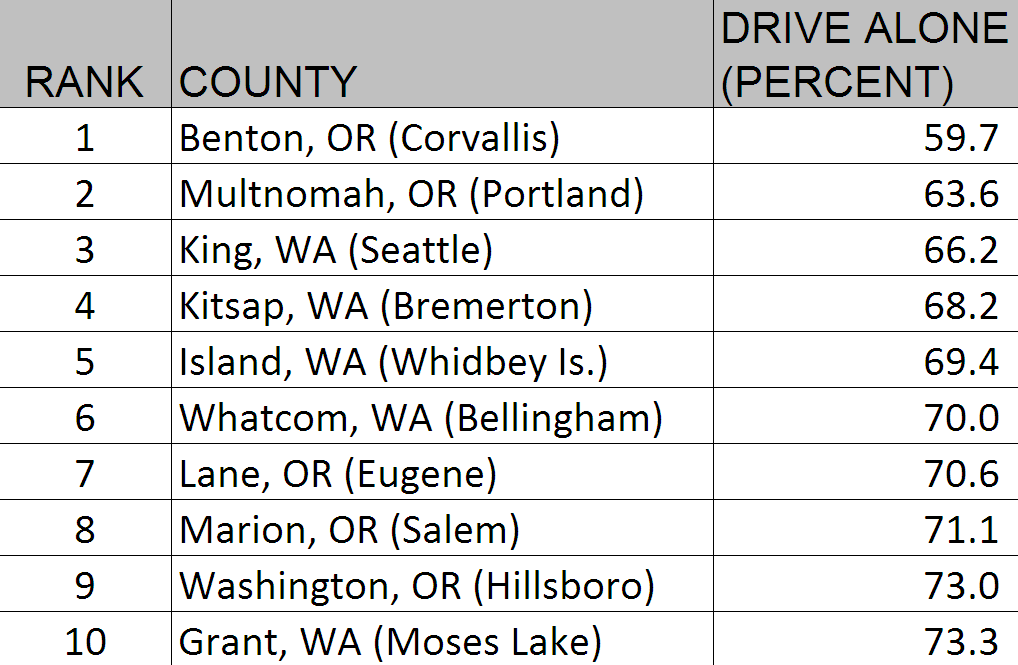
Parse the data by county, however, and things look a bit different:

That said, county-level comparisons are tricky. Multnomah County, for example, is a small and urbanized county; it’s not really comparable to sprawling King County, which extends from the Cascade Crest to Puget Sound. Just so, Benton County, Oregon is tiny compared with, say, Snohomish and Pierce counties in Washington.
I included Idaho cities and counties in my rankings, but no place in Idaho made it into the Top 10. In fact, the only place east of the Cascades that made it was the somewhat puzzling placement of Grant County, Washington.
Anyway, I thought it was all interesting. But it’s hardly an excuse for excessive boasting. Ranked nationally, Seattle nets only 25th place for having the smallest share of drive-alone commuters, while Portland ranks 50th. Although the Northwest certainly does better than most places, when one consider peers like Washington, DC (36.5 percent), Boston (37 percent), or San Francisco (38.9 percent), we can see that our work is cut out for us.
Notes: All data come from 2009 American Community Survey 1-Year Estimates, table “GCT0802. Percent of Workers 16 Years and Over Who Traveled to Work by Car, Truck, or Van—Drove Alone,” here. For simplicity, I did not include margins of error in these tables. Please keep in mind that although they are only a percentage point or two for the higher-population locales, in some of the small cities and counties they can be as high as +/- 4 or 5 percent.


Cascadian
There’s certainly a lot to be done, but Seattle scoring 25th nationally (was that ranking for the city, county, or MSA?) isn’t a bad result for a city that’s 23rd largest in population. In terms of metro areas (15th in population) and largest counties (14th), we could be doing better, but “dismal” is unfair. Portland’s 50th place ranking when it’s the 30th largest city (23rd largest metro) is a little bit more out of scale, but still not horrible.What it does say is that it’s the suburban and exurban areas in the Northwest that do poorly. The urban cores are doing about as well as could be expected, but the sprawling population around that core is where single vehicle dominance is a huge and disproportionate problem.
Eric de Place
Okay, you’re right, Cascadian: “dismal” is too strong. I’m going to tweak the text a little.The rankings of 25th and 50th I referred to are for cities (not counties or MSAs).