Minority rule sounds bad enough in theory: undemocratic, unconstitutional, and unfair. But in practice, its ramifications become even worse.
If Washington voters approve BP-funded and Tim Eyman-sponsored I-1053 in November, just 17 members of the Washington Senate will hold veto power over closing tax loopholes and raising revenue.
Who are those 17?
In principle, it could be any 17 senators, but in reality, it would be the 17 most conservative members—the minority most opposed to closing loopholes and raising revenue. (For political junkies, I include a list at the end of the post.)
That’s a group far to the right of the state’s political center of gravity. Judging from their voting records, they are twice as conservative as the typical member of the state senate. All white, mostly male, and mostly from outlying places like Ritzville and Moses Lake, they are also mostly Republican. My argument here is not partisan, however: They are not all Republicans, and not all Republicans are among them.
The 17’s philosophy is as legitimate a part of public discourse as anyone’s, but no one should think that they are simply a few degrees right of center on the state’s political continuum. They are a distinct ideological minority, polarized away from the governing coalition in Olympia.

(Larger version of chart here.)
Consider their voting records. Several statewide organizations assemble legislative scorecards by selecting a set of indicative votes and using them to give legislators points. A legislator who always voted against a group’s recommendations would get a “0,” and one who always voted with the group would get a “100.”
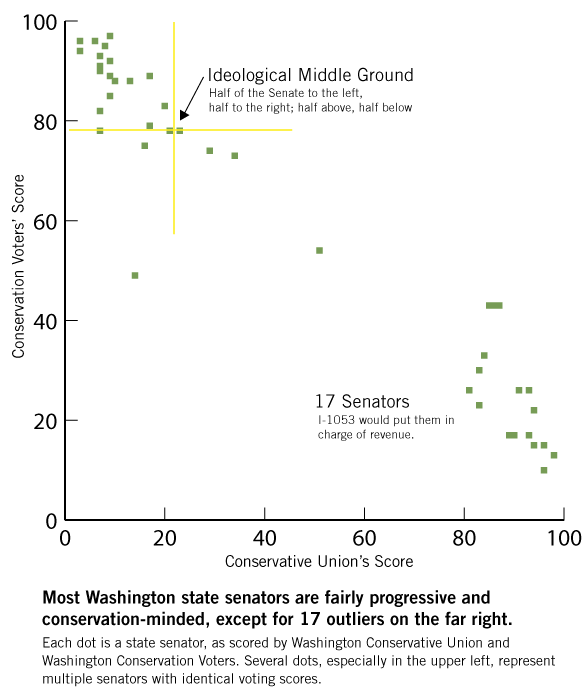
The chart above shows current members of the senate by their lifetime ratings from the right-wing Washington Conservative Union (on the horizontal scale) and from the environmentalist Washington Conservation Voters (on the vertical scale). A point in the center of the graph would be a senator who had a score of 50 from each group. A point in the upper left would be a senator with a high score from conservation advocates but a low score from the conservative group. Conversely, a dot in the lower right reflects a senator who scored well on the conservatives’ scorecard but poorly on the conservationists’.
There are seventeen dots in the lower right, all of them between 80 and 100 on the Conservative Union’s scale and none of them higher than 43 on the Conservation Voters’ scale. And there’s hardly anyone in the middle of the chart. Most of the senators—25 of them—are in the upper left section of the chart—not very conservative and fairly conservationist. (The chart also illustrates how deeply polarized Washington politics are.)
Under majority rule, you would expect public policy to reflect the ideological middle ground of the senate—the point (marked in the chart) at which half of senators are to the right, half to the left, half above and half below. In this case, moderate state senator Chris Marr (D—Spokane) is the closest to the middle ground, so you would expect the senate to pass laws aligned with Senator Marr’s middle-of-the-road philosophy. I-1053’s imposition of minority rule would move power far to the lower right of the chart, making someone like conservative Senator Tim Sheldon (D—Potlatch) the senate’s pivotal vote.

(Larger version of chart here.)
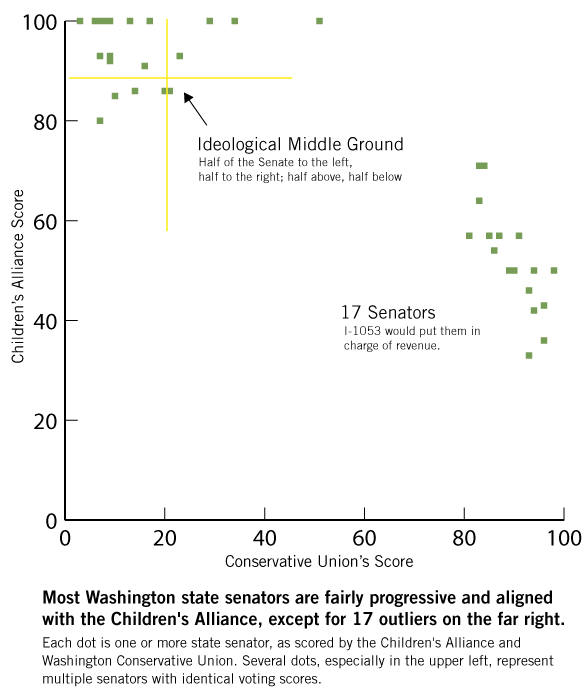
This second chart substitutes voting scores from the Children’s Alliance of Washington, which advocates for child welfare policies and programs, for the Washington Conservation Voters’ scores in the first chart.
The pattern is similar. The same 17 senators are clumped together on the lower right (scored very high by conservatives and very low by the Children’s Alliance). Meanwhile, the majority of senators are in the upper left (with low scores from the conservatives and high scores from the children’s advocates). Again, minority rule would move the chamber’s pivot point (roughly) from the moderate Marr to the conservative Sheldon—a long distance in political values.
But wait. These two charts aren’t specific to the subject matter of I-1053, which is about closing tax loopholes and raising revenue, not our natural heritage or child welfare. I’ve been using Washington Conservative Union, Washington Conservation Voters and Children’s Alliance scores as proxies for political values.
Are they good proxies? Do these other legislative scorecards align with senators’ voting records on tax loopholes and new revenue? Unfortunately, no one assembles a state voting scorecard solely on revenue questions, but I did a short-hand version myself. I selected what the nonpartisan Project Vote Smart listed as the three most critical revenue votes in the 2010 legislature, when the state faced a second year of record revenue shortfalls. The final state budget closed those shortfalls mostly by slashing state services, such as healthcare for low-income families. It also raised a modest amount of new revenue by closing tax loopholes on out-of-state businesses that operate in Washington and by raising taxes on—or ending tax exemptions for—cigarettes, bottled water, candy, and soda pop.
The three senate votes in my short-hand scorecard were:
1. HB 2493, which raised cigarette taxes to prevent even steeper cuts in basic healthcare services than were already planned.
2. SB 6143, which closed tax loopholes for out-of-state businesses and other businesses and ended tax exemptions or levied excises on bottled water, candy and chewing gum, soda pop, and various tobacco products such as snuff.
3. SB 6130, which temporarily suspended I-960, the minority-rule initiative passed narrowly by voters in 2007.
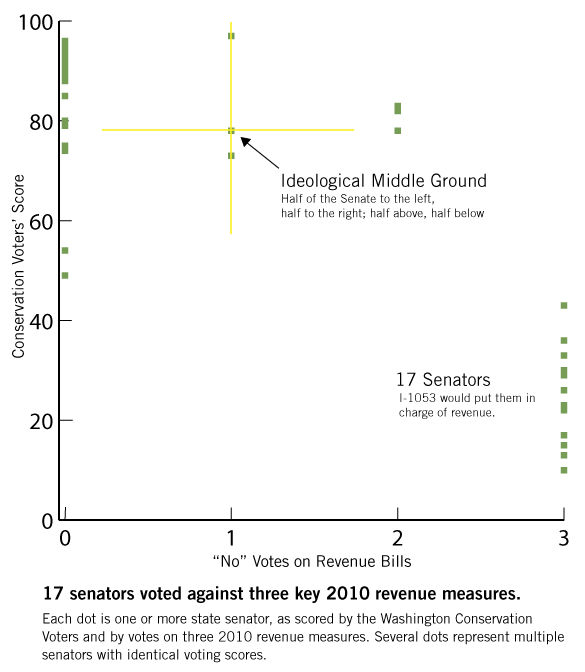
Did 2010 votes on closing tax loopholes and raising new revenue correlate with the voting scores from the advocacy organizations? Does the pattern look the same? Yes.
 <!–
<!–
p>
(Larger version of chart here.)
In the chart, the same seventeen senators (in the lower right) voted against all three revenue measures. All have lifetime conservatism voting scores of 81 or higher and lifetime conservation voting scores of 43 or lower. With the exception of two others who joined the group of 17, all other senators voted “yes” on at least one of these revenue measures, and all have conservatism scores of 51 or lower and conservation scores of 49 or higher.
Seventeen senators is all I-1053 requires to block revenue measures, and the state senate has 17 who voted against all revenue measures—even in an unprecedented fiscal downturn. They also vote overwhelmingly against the recommendations of environmental and child-welfare advocates.
This group presents a strikingly different ideological profile than the rest of the senate. Their average lifetime conservatism voting score is 90, more than twice the average lifetime score of all state senators, which is 43. Their average lifetime conservation voting score is 25; the senate average is 62.Their average child welfare voting score is 52, compared with 79 for the senate overall.
They are a group apart, these seventeen. They are radically to the right of their peers. And I-1053 would put them in charge. That’s what minority rule looks like.
. . . .
Notes and data: Here is the list of senators, with their voting scores and records. The 17 are bolded.
| Senator | WCU | WCV |
CAW | Revenue Score |
|---|---|---|---|---|
| Jim Honeyford, R-Sunnyside | 96 | 10 | 36 | 3 |
| Val Stevens, R-Arlington | 98 | 13 | 50 | 3 |
| Bob Morton, R-Kettle Falls | 94 | 15 | 50 | 3 |
| Mark Schoesler, R-Ritzville | 96 | 15 | 43 | 3 |
| Bob McCaslin, R-Spokane Valley | 89 | 17 | 50 | 3 |
| Jerome Delvin, R-Richland | 90 | 17 | 50 | 3 |
| Janéa Holmquist, R-Moses Lake | 93 | 17 | 46 | 3 |
| Mike Hewitt, R-Walla Walla | 94 | 22 | 42 | 3 |
| Mike Carrell, R-Lakewood | 83 | 23 | 64 | 3 |
| Linda Evans Parlette, R-Wenatchee | 91 | 26 | 57 | 3 |
| Joseph Zarelli, R-Ridgefield | 93 | 26 | 33 | 3 |
| Pam Roach, R-Auburn | 81 | 26 | 57 | 3 |
| Curtis King, R-Yakima | 29 | 50 | 3 | |
| Don Benton, R-Vancouver | 83 | 30 | 71 | 3 |
| Tim Sheldon, D-Potlatch | 84 | 33 | 71 | 3 |
| Randi Becker, R-Eatonville | 36 | 57 | 3 | |
| Dale Brandland, R-Bellingham | 86 | 43 | 54 | 3 |
| Dan Swecker, R-Rochester | 87 | 43 | 57 | 3 |
| Cheryl Pflug, R-Maple Valley | 85 | 43 | 57 | 3 |
| Brian Hatfield, D-Raymond | 14 | 49 | 86 | 0 |
| Jim Hargrove, D-Hoquiam | 51 | 54 | 100 | 0 |
| Rodney Tom, D-Medina | 34 | 73 | 100 | 1 |
| Mary Margaret Haugen, D-Camano Island | 29 | 74 | 100 | 0 |
| Jean Berkey, D-Everett | 16 | 75 | 91 | 0 |
| Chris Marr, D-Spokane | 21 | 78 | 86 | 2 |
| Paull Shin, D-Edmonds | 23 | 78 | 93 | 1 |
| Steve Hobbs, D-Lake Stevens | 7 | 78 | 93 | 2 |
| Jim Kastama, D-Puyallup | 17 | 79 | 100 | 0 |
| Randy Gordon, D-Bellevue | 80 | 0 | ||
| Claudia Kauffman, D-Kent | 7 | 82 | 80 | 2 |
| Derek Kilmer, D-Gig Harbor | 20 | 83 | 86 | 2 |
| Phil Rockefeller, D-Bainbridge | 9 | 85 | 93 | 0 |
| Rosa Franklin, D-South Tacoma | 13 | 88 | 100 | 0 |
| Ken Jacobsen, D-Seattle | 10 | 88 | 85 | 0 |
| Margarita Prentice, D-Renton | 9 | 89 | 93 | 0 |
| Tracey Eide, D-Federal Way | 17 | 89 | 100 | 0 |
| Lisa J. Brown, D-Spokane | 7 | 90 | 100 | 0 |
| Karen Keiser, D-Kent | 7 | 90 | 100 | 0 |
| Debbie Regala, D-Tacoma | 7 | 91 | 100 | 0 |
| Kevin Ranker, D-San Juans | 91 | 100 | 0 | |
| Eric Oemig, D-Kirkland | 7 | 91 | 100 | 0 |
| Rosemary McAuliffe, D-Bothell | 9 | 92 | 100 | 0 |
| Joe McDermott, D-West Seattle | 93 | 100 | 0 | |
| Ed Murray, D-Seattle | 7 | 93 | 100 | 0 |
| Darlene Fairley, D-Lake Forest Park | 3 | 94 | 100 | 0 |
| Karen Fraser, D-Olympia | 8 | 95 | 100 | 0 |
| Jeanne Kohl-Welles, D-Seattle | 3 | 96 | 100 | 0 |
| Adam Kline, D-Seattle | 6 | 96 | 100 | 0 |
| Craig Pridemore, D-Vancouver | 9 | 97 | 92 | 1 |
The Washington Conservative Union’s (WCU) most-recent scorecard covers the 2007 legislative session and the previous four sessions. Consequently, it excludes more
-recent votes and five senators elected to the state senate after 2007. To rank all senators in the list above, therefore, I relied on the Washington Conservation Voters’ (WCV) lifetime ratings. The Children’s Alliance of Washington (CAW) scores listed here are only from the 2009 legislative session. The Revenue Score is the number of “no” votes (or, strictly speaking, not “yes” votes, as some senators do not vote, which has the same effect as voting “no”) on three critical revenue measures (HB 2493, SB 6143, and SB 6130) in the 2010 legislative session.


Jon Stahl
Amazing use of data to tell an ugly story. Nice work, Alan!
Pru
You fail to address the fact that these 17 senators REPRESENT THEIR DISTRICTS’ voting profiles—duh! Everyone can’t be a Seattle liberal.
Eric de Place
Pru,You’re missing the point. An objective look at voting records shows that the so-called “Seattle liberals” are actually very close to the state’s ideological center. By contrast, there are 17 districts that are far, far outside the state’s political center. And it’s these 17 that would be effectively running the show if I-1053 passes.
data
Is it any wonder these 17 senators are trying to create a loophole with I-1053 in order to save their own, er, loopholes?…
Alan Durning
Pru,No, I’m not missing the point. I’m making the point. The point is that I-1053 would move power over revenue very far from the political middleground of the state. It would make the senators (and, yes, the constituents who elected them) from 17 out of 49 districts the arbiters of tax loop holes and revenues. I think the residents of the state’s other 32 districts deserve to understand this.Data,Well put. But, just to be precise, I-1053 does not come from the legislature. It’s a citizens’ initiative. Initiative entrepreneur Tim Eyman wrote it, and BP and other oil companies are bankrolling it.
Data
And the bankrollers, Eyman and Slick Oil, are anticipating handing over the keys to the bank to the minority 17, it seems. The minority deserve to be heard, and their point of view reasonably considered. But we need to remember that America is a Democracy and not an oligarchy. Good research, Alan!
Sarajane Siegfriedt
This is a terrific graphical representation of how far to the right these 17 Senators are. Thanks for connecting the dots…literally.
morgan
I’m also wondering whether majority rule is all that great. Majority-rule can easily lead to unjust outcomes, especially when the minority’s preferences are greatly different from those of the majority. It’s much easier to discount and overrun a minority whom you don’t understand. But, next to the theoretical benevolent dictator, majority rule is the best we can come up with as a governance principle.
morgan
I’m not so sure that the ideological middle ground is placed all that fairly. Were the 17 nicely snuggled up to the rest of the legislator, this middle ground calculation wouldn’t shift. But, no big deal.
Morgan
I mean to write at the front of my first post: It seems that the fundamental issue is whether, in a deeply divided state such as Washington, this method of decision-making is what we want.
Georgie Kunkel
My definition of liberal is anyone who believes that everyone in the world who is born deserves to eat and be housed.In some circles that is even called radical.And yes, representatives reflect their constituency or at least they are supposed to. Too bad that so many in our state arenot willing to serve all people, the poor and rich alike.
Data Bass
Here’s some food for thought from an insightful quote found featured at the end of this cool video:”The test of our progress is not whether we add more to the abundance of those who have much; it is whether we provide enough for those who have too little.”
Alan Durning
Morgan,Political theorists have demonstrated that any voting system or legislative rule can have imperfect or counter-intuitive results. But majority rule is better than the alternatives in almost all cases, as this game-theory paper illustrates: http://bit.ly/bAeNeFAlan
MicheLynne
Interesting paper. Thanks for sharing it. After reading it, though, this question comes to mind: Could it, perhaps, be the case that the *best* way to govern a democratic country is somewhere *between* the majority (50+%) and the super-majority (60+%) rule? In other words, perhaps a 55+% rule could keep the momentum going to improve the status quo, while at the same time enabling the *vigorous debate required* by the super-majority rule that keeps the status quo from jumping off a cliff? (As an Independent, I always try to see the “best of both worlds”…)
MicheLynne
I knew I must’ve heard about the “55 idea” somewhere before (probably here on Sightline or over at Grist). Anyhoo … found the link for it. Alan, do you have any thoughts about this idea? If so, would love to hear ’em!
Matt the Engineer
I’d love to see a variable line set by popular vote. Government too unstable? Vote to increase the percentage. Time for change? Vote to decrease it.