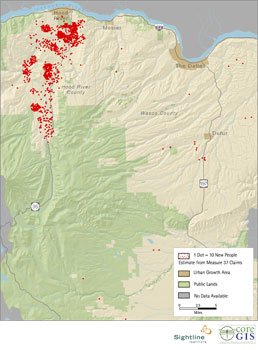
Here’s a look at how Measure 37 sets the stage for nearly unrestrained population growth in the Hood River region’s exurban areas.
In the map below, each red dot represents 10 new people based on active Measure 37 claims.
Bigger and clearer versions are here. And here is an index of all the new Oregon Measure 37 maps.
In the two counties shown here—Hood River and Wasco—there are 254 active claims to add housing. These claims could add 5,718 new housing units and nearly 14,000 new people, almost all of them in areas that are currently open space or farms.
Here’s the breakdown:
| county | active housing claims | new dwelling units | new residents |
| Wasco | 41 | 184 | 345 |
| Hood River | 213 | 5,534 | 13,311 |
As the map reveals, there are numerous claims clustered in the Hood River Valley’s prized farmland. (See here for better versions.) Tomorrow, we’ll zoom in for a closer look at the valley.
Thanks to CORE GIS for maps and analysis, and to Deric Gruen for the legwork.


