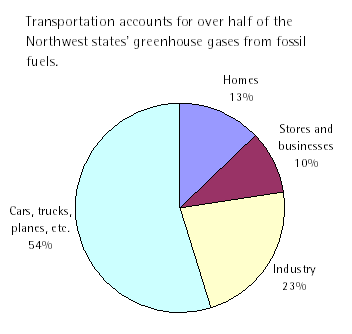
I’m not sure why this surprises me, but it does: in the Northwest states, transportation—our cars and trucks, plus planes, boats, and trains—accounts for the majority of the region’s CO2 emissions from fossil fuels.
When you break the numbers down a bit more, gasoline alone accounts for almost a third of all energy-related CO2 emissions.
For the country overall, transportation represents only about one third of total emissions from fossil fuels. But that’s mostly an accident of geography: the Northwest’s hydropower is relatively climate-friendly, which keeps emissions from homes, businesses and industry relatively low; whereas coal—which supplies most of the nation’s electricity—is a first-order climate offender. Nationwide, electricity generation accounts for nearly 40 percent of total climate-warming emissions from fossil fuels.
One thing that the numbers suggest is that, if you want to take a bite out of global warming in the Pacific Northwest, the best place to start is with gasoline, which is by far the largest single source of emissions in our energy portfolio.
But beware—in some ways the chart is misleading. Based on the chart alone, it’s easy to conclude that our emissions from electricity aren’t a big deal. But that’s a mistake.
Sure, on average, the Northwest’s electricity consumption is pretty benign. But on the margins—ie., what gets added or subtracted when consumption trends up or down—our electricity is every bit as dirty as the rest of the country’s. We’re already importing a lot of power from coal plants outside the region, especially during the winter months when demand peaks. If demand here increases, we’ll have to import more coal-fired power. If demand slackens, we’ll be able to export more hydropower—likely offsetting coal and gas-fired electricity elsewhere.
So even though transportation represents the bulk of our energy-related emissions, using electricity more efficiently—and generating it renewably—is still one of the best things we can do to reduce our impact on the climate.


Laurence Aurbach
Here’s a chart of greenhouse gas emissions I put together a while back. It breaks down U.S. transportation emissions by vehicle type and is drawn from EPA’s 2004 inventory.Two figures from DOE round out the picture. This table shows that energy use by buildings is responsible for 39% of U.S. CO2 emissions. This pie chart breaks it down by end use.Bottom line, the biggest sources of greenhouse gases from the commercial, residential and transportation sectors are 1) driving cars and trucks, and 2) heating and cooling in buildings. Together those account for almost one-half of U.S. greenhouse gas emissions.
Clark Williams-Derry
That’s great stuff, Laurence. Thanks!
m. leber
I find this a bit shocking: .4% of greenhouse gas emissions are caused by buses. Are so few people using transit that this number is as low as it is? Or are buses really that efficient?
cheney
I am wondering whether this figure is so low as quite a number of buses in the Northwest are zero emission vehicles (their power comes from wires suspended above them like LRT) in Vancouver,BC and Seattle which use half the energy of diesel buses. The trolleybus fleet in Vancouver is also partially powered by Green electric (1/3 rd of the power is certified green and 80% + of BC’s power is Hydro electric so the CO2 emissions are next to nothing). But in other Northwest cities transit use is lower due to lower density cities so what you first suggested might be correct. For example Portland has a lower density than the Vancouver suburb of Surrey. Long live urban density and the Trolleybus.
Clark Williams-Derry
Matt -I think it’s that not that many vehicles are transit buses. During my rush hour commute, I probably see 30 cars for every bus—and that’s during peak hours for bus ridership.A full bus is pretty efficient; but that said, most bus *systems* are no more fuel efficient than cars, in terms of total passenger miles per gallon. That’s because lots of buses run when they’ve got few riders, which balances out the times when they’re full.cheney-I think that Laurence’s figures are for the US, not for the Northwest—so electrified buses don’t figure too heavily in his stats. (Correct me if I’m wrong, Laurence!)
Laurence Aurbach
Yes, the EPA figures are for the entire U.S., not the Pacific Northwest. Bus emissions make up such a tiny share because the number of miles driven by buses is absolutely dwarfed by the number of miles driven by cars and light trucks. This table spells it out. In 2003 buses, including school buses, traveled 6.8 billion miles; transit buses traveled 2.4 billion miles and trolley buses traveled 14 million miles. Meanwhile, cars and light trucks traveled about 2.7 trillion miles. That’s about 400 times (or 40,000 percent) more miles than buses.