fbpx
Donate Newsletters

Preview: Stuck in a Jam

Several months ago, I sat down with a few earnest young filmmakers of Undrgrnd Productions, who were eager to discuss one of my own favorite topics: traffic!

Just this morning, Luv, Vijay, and Mahim emailed me the trailer for their film. As they write, “it’s about traffic and transit, but also about related issues like housing, density, the city’s exploding growth, its history, politics, and problems.” Yep—traffic conversations certainly surface all of those other topics as well. The full film will debut in August, but for now, be sure to check out the trailer:

More Tolls for Tacoma Narrows

The Kitsap Sun is reporting that a $1 per car toll increase on the Tacoma Narrows Bridge west of Tacoma, Washington is “close to a done deal.”

On July 1, rates will rise to $5 for Good To Go! electronic payment, $6 at the toll booths and $7 for pay-by-mail. A déjà vu will occur one year later.

WSDOT believes that if tolls on the bridge don’t rise, there’s a good chance that the state won’t have enough tolling revenue to cover the financing costs for the $728 million second span, which was opened to the public in 2007. Tolling shortfalls, in turn, could force WSDOT to dip into general transportation funds for a project that was supposed to pay for itself.

As the chart below shows, traffic across the bridge has consistently failed keep up with the forecasts. Traffic has been basically flat: despite a modest uptick in 2014, actual traffic volumes (the thick green line) are still about the same today as in 2009.
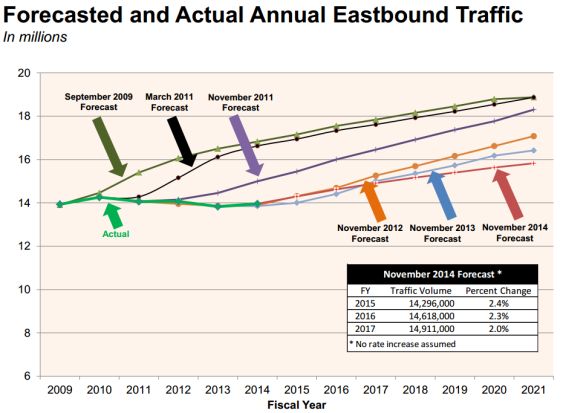
Tacoma Narrows Bridge - actual and projected traffic
TNBCAC presentation, p. 17 by WSDOT

Read more

The Comedy and Tragedy of the Port Mann Bridge

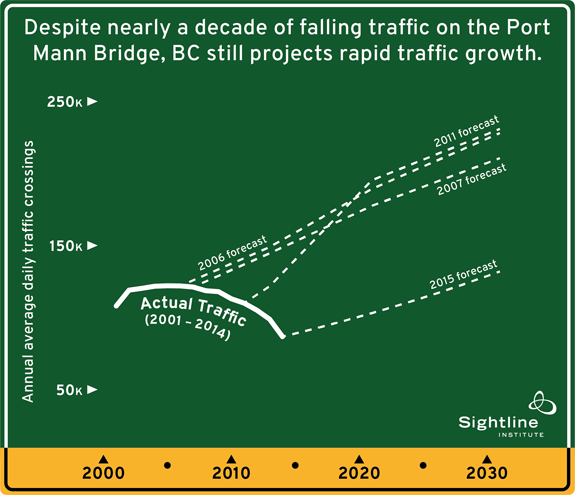
The comedians in the Port Mann Bridge forecasting department are at it again: despite a 29 percent decline in traffic volumes on the Port Mann bridge between 2005 and 2014, the province is still predicting an immediate, sustained increase in traffic across the span:

Port-mann traffic 375

That’s right—despite years and years of being wrong about the direction of future travel trends, they think they’ve finally spotted signs of a turnaround. You see, traffic volumes in December 2014 and January 2015 were a wee bit higher than they were in December 2013 and January 2014. And apparently that was enough for them to declare that..

“Traffic volumes on the Port Mann Bridge are stable and growing.”

and to make a forecast of…

“continual, long-term traffic growth on the Port Mann Bridge at a rate of about 2.5% per year.”

Read more

Washington State Traffic Forecast Finally Recognizes Reality

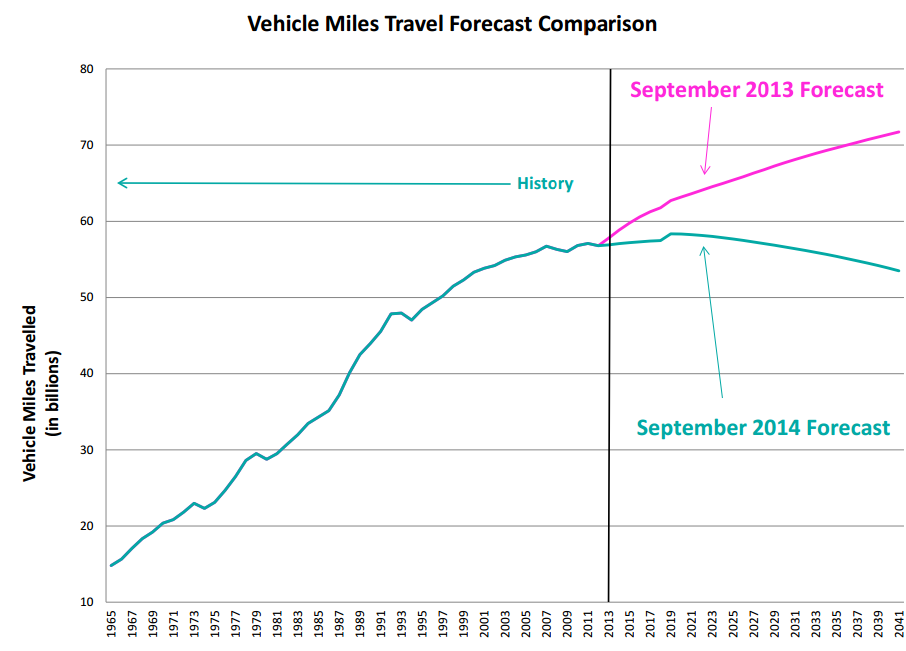
This is far and away the most responsible official traffic forecast I’ve seen from any government agency, ever:

Washington State Transportation Revenue Forecast Council - Peak Traffic
VMT forecast comparison by Washington OFM, Transportation Revenue Forecast Council

It’s from a new transportation revenue forecast (pdf link, see p. 27) recently published by the Washington State Office of Financial Management. Their forecast from last September, in pink, assumed that traffic would grow endlessly, much as it did during the 1950s through 1990s. But the new forecast, in blue, assumes that the modest traffic growth of the past decade will continue, and will then be followed by a slight decline.

There are two reasons why this forecast is such a refreshing change. First, it reflects the growing empirical evidence of a long-term slowdown in the growth of vehicle travel, evident on major roads in Washington, for Washington State roads as a whole, for the US, and for much of the industrialized world.

Second, even if the forecast is wrong, assuming that traffic won’t grow much is the most fiscally prudent way to plan a transportation budget.

Read more

Another Look at Declining Seattle Traffic

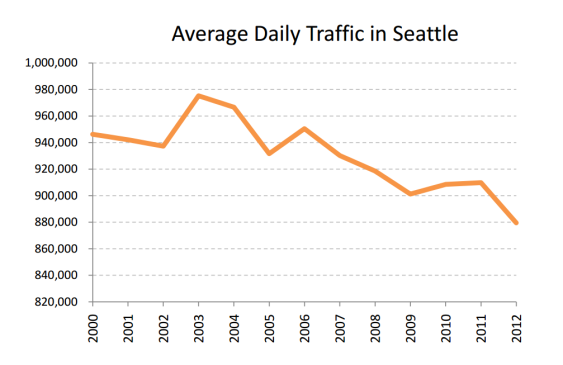
Every year, the Seattle Department of Transportation tracks traffic at 19 select bridges across the city, and presents the resulting traffic count as a rough-and-ready gauge of citywide traffic trends. And based on these counts, SDOT believes that traffic across the city fell by a whopping 10 percent between 2003 and 2012:

Seattle traffic trends
From the 2012 Traffic Report, Seattle Department of Transportation

But it gets more dramatic. The US Census Bureau says that Seattle’s population grew by 11 percent over the same period—suggesting a drop in per capita vehicle travel of more than 20 percent in a single decade.

Meanwhile, transit ridership in Seattle grew by nearly 40 percent from the early 2000s through 2012:

Read more

Traffic on the Viaduct: Falling, But Maybe Not So Fast

Oy. A few weeks back I wrote about new data from the Seattle Department of Transportation showing that traffic on the Alaskan Way Viaduct had plummeted. But now, SDOT is backing away from their numbers:

In 2012, due to the ongoing construction of the South Atlantic Street overpass, we were not able to collect valid data for the SR 99 on- and off-ramps located near the stadiums. As a result, SDOT was not able to calculate our own number for 2012 volumes on the Alaskan Way Viaduct.

Instead, a volume from a Washington State Department of Transportation (WSDOT) counter on SR 99 south of the stadium ramps was used…These changes in the data should have been noted on the 2012 Traffic Flow Map, but were not.

This means that our chart, which showed a collapse in traffic volumes on the Viaduct, was based on data that SDOT no longer supports—which suggests that it could well be wrong.

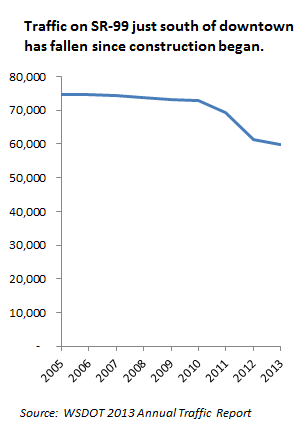
However, that’s not the end of the story. WSDOT just released its 2013 Annual Traffic Report, with a consistent time series for SR-99 just north of the West Seattle Bridge. And that time series still shows a sizable drop in SR-99 traffic:

Read more

Can DOTs Help Themselves?

There’s an old fable about a scorpion and a frog: the frog generously offers to carry a scorpion across a river…but halfway across, the scorpion stings the frog, drowning them both. With its dying breath, the frog asks why the scorpion did something so stupid, and the scorpion replies: “I can’t help myself. Stinging is what scorpions do!”

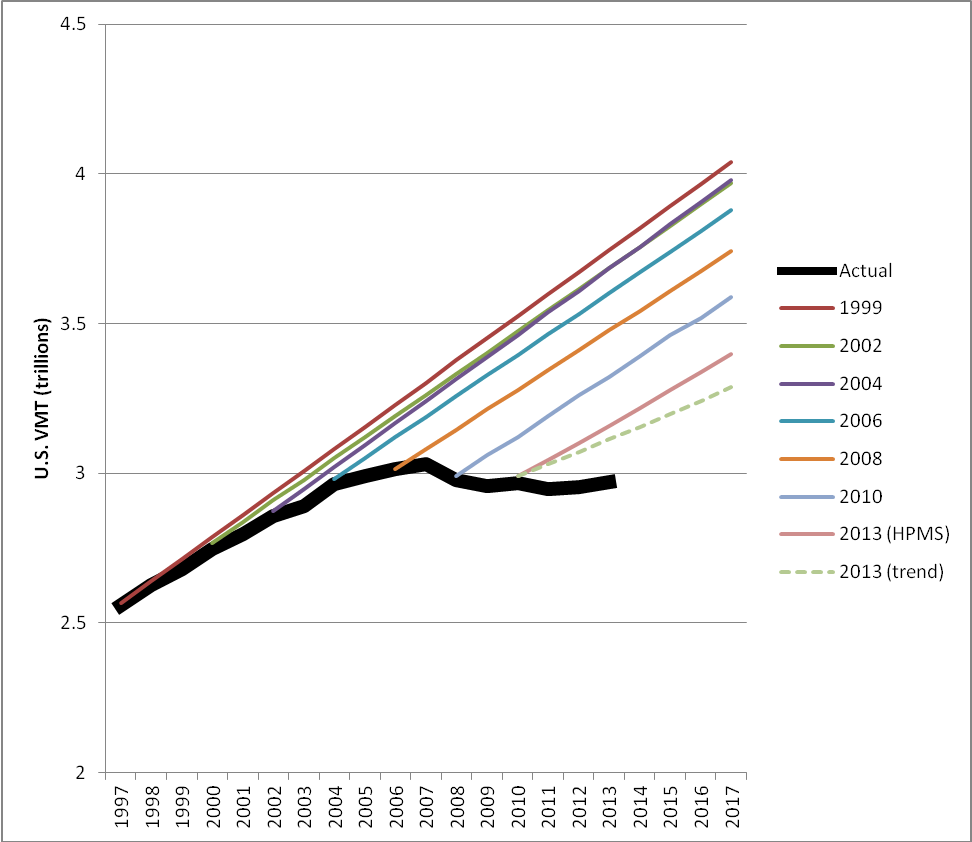
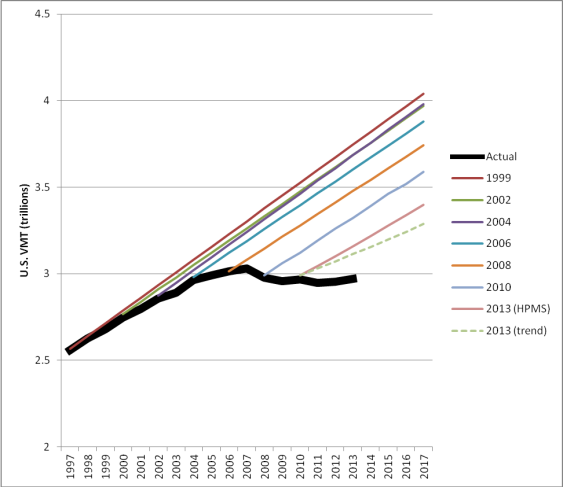
I thought of this fable when a saw this new chart from the State Smart Transportation Initiative, comparing the US Department of Transportation newest vehicle travel forecasts with previous versions. Like the scorpions in the fable, it seems the nation’s traffic forecasters just can’t help themselves: forecasting rapid traffic growth is just what DOTs do.

SSTI conditions and performance chart
USDOT VMT forecasts by SSTI

Read more

Traffic on the Alaskan Way Viaduct Has Collapsed

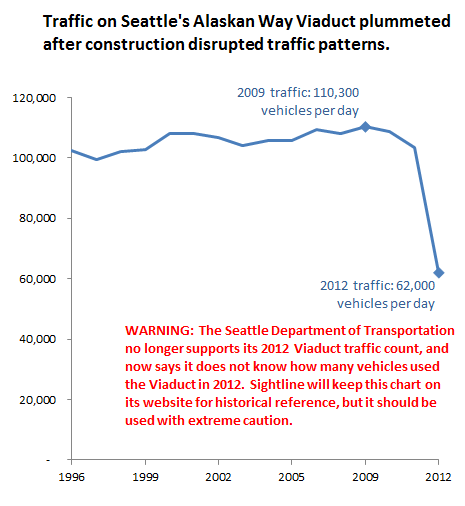
UPDATE: The Seattle Department of Transportation (SDOT) has now backed away from its previously published Viaduct traffic counts!! The agency now says that it has no idea how many vehicles used the Viaduct in 2012. See our update on Viaduct traffic data—and be advised that this post, and particularly the chart below, are based on data that SDOT no longer supports!

Bertha’s woes are hogging the spotlight. But while everyone’s been looking down, something going on up in the air may prove just as important in the long run: traffic volumes on the Alaskan Way Viaduct have collapsed since the state started its construction project.

Take a look at the trends, courtesy of the Seattle Department of Transportation’s traffic maps:Viaduct traffic count - with warning

Astonishing! Viaduct traffic fell by 48,000 trips in 3 years—a reduction that, I’m sure, many transportation planners would have thought unthinkable.

Where did the traffic go?

Read more

TransLink’s Gasoline Problem

Last Friday’s excellent Vancouver Sun story put a much needed spotlight on the Golden Ears Bridge—where traffic is running so far behind projections that TransLink now forecasts that the agency will lose between $35 and $45 million per year on the bridge, for at least the next several years.

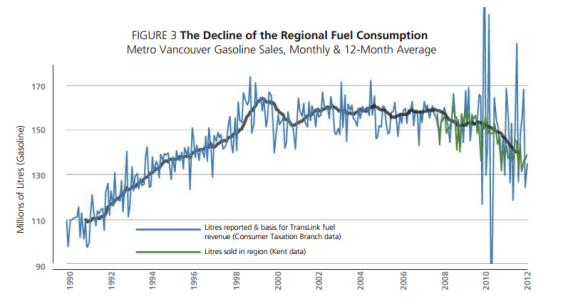
But the story is really just the tip of the iceberg in a much larger story about Greater Vancouver’s transportation finance woes. Not only are bridge tolling revenues falling behind projections, but gas tax revenues are too. Take a look at the black line in the chart below, representing the 1-year average gasoline sales volumes in Metro Vancouver:

Translink 2013 Base Plan, p. 12

Read more

Tacoma Narrows Bridge: It Is Happening Again

For those of you old enough to remember Twin Peaks, I present my suggestion for the ideal spokesperson for the Washington State Transportation Revenue Forecast Council:

OK, now that the shivers have worn off, let me explain.

WSDOT depends on revenue from tolling to pay for some of its construction projects. One notable example is the Tacoma Narrows Bridge: WSDOT added a second, tolled span in 2007, counting on steady growth in traffic volumes to pay for the original construction costs.

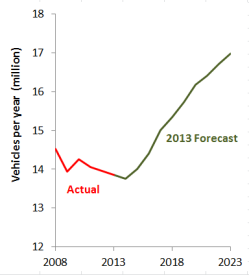
Tacoma Narrows Bridge traffic: actual vs.forecastBut instead of rising steadily, as originally projected, traffic started tapering off. (See the red line to the right.) At first, transportation planners pinned the declines to the Great Recession of 2009. But after rebounding in 2010, traffic across the bridge has fallen slightly for three consecutive years—confounding policymakers, and forcing a series of controversial rate hikes.

Still, despite higher toll rates that appear to be discouraging additional traffic, state transportation forecasters are once again projecting a prompt increase in traffic—with annual growth rates increasing from 2 percent in 2015 to 4 percent in 2017, before tapering back down to around 1.5 percent in 2022.

So why the creepy Twin Peaks guy? Simple: the new forecasts essentially represent a return to the failed 2006 forecasts, which predicted endless growth in traffic that would quickly pay for the construction costs for the new span:

Read more