10/31/2007 Update: We have new versions of these transportation charts for each Northwest state in shareable forms.
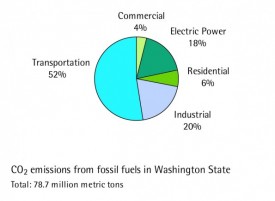
In the Northwest, it’s impossible to address climate change without doing something about transportation. Take a look at this chart showing CO-2 emissions from fossil fuels in Washington.
In Washington (as in Oregon), everything else pales in comparison to the emissions that come from transportation. In fairness, the chart shows only emission from fossil fuels. But fossil fuels represent better than four-fifths of the state’s entire portfolio of greenhouse gas emsisions. They’re also the emissions that are best understood, and by far the most practical to cover in carbon legislation, such as cap and trade.
Whether we aim to reduce our climate emissions by 80 percent below 1990 levels (the amount that scientists say is necessary in the developed world if we’re to slow climate change) or by 50 percent (the target that the state’s leaders have proposed), there’s pretty much no way to get around making big cuts in transportation emissions.
On a related note, the Western Climate Initiative—the group of western states and provinces setting a joint climate strategy—just announced their shared target. I was actually a bit surprised when I saw the numbers.
The participants agreed to an aggregate reduction of 15 percent below 2005 levels by 2020. Not too shabby! (They also acknowledge that “current science suggests that this will require worldwide reductions between 50% and 85% in carbon dioxide emissions from current levels by 2050.”)
The WCI’s new goal is comparable to the goals that Washington and California have set (1990 levels by 2020), though it’s less aggressive than the non-binding goals set by Oregon and British Columbia (10 percent below 1990 by 2020).
I take WCI’s action as great news. But, as in the Northwest, addressing climate change in the West will mean doing something meaningful about transportation emissions. Here’s a chart showing fossil fuel emissions for the US West:
The main difference with Washington’s portfolio is that some western states use more CO-2-emitting coal power, so transportation shrinks a little bit as a share of total emissions. Still, it’s far and away the biggest obstacle to a responsible climate policy.
A couple of footnotes to this post. The charts in are based on 2003 data and they appear courtesy of uber-intern Justin Brant.
The WCI formally includes Arizona, British Columbia, California, Manitoba, New Mexico, Oregon, Utah, and Washington. In addition, there are a number of “observers” who may join in the near future: Colorado, Kansas, Nevada, Ontario, Quebec, Saskatchewan, and Wyoming, plus the Mexican state of Sonora. (I suppose there’s a semantic question about whether it can still be the Western Climate Initiative if Quebec joins, which, last time I checked, borders the Atlantic Ocean.)


Yoram Bauman
Apparently I’m just in a comment-happy mood today. Here’s my comment on this: many people who know better (like the Governator) have propagated the myth that transportation = passenger cars. (In fact, motor gasoline is only about 60% of emissions; the rest are roughly evenly divided between jet fuel and diesel fuel used mostly by trucks.) Although you don’t contribute to the myth in your post, you also don’t clarify. And I think you should; otherwise all those people pushing for policies like higher fuel-economy standards for passenger cars are going to be disappointed when they find out that passenger cars aren’t as big of a deal as they’d been led to believe.
Yoram Bauman
Sorry, I should have been more clear: motor gasoline is only about 60% of transportation emissions…
Kade
Even taking what Y.B. says into account, 60% of transportation’s 50% of the total is still 30% of that total, which I think is sizable enough to matter. I won’t be disappointed when we get better standards for cars. I just won’t be content yet, either.