This is part two in a three part mini-series about how accessory dwelling units—in-law apartments and backyard cottages—change the urban carbon footprint. You can read part one here.
The consequence of having widespread, outdated zoning laws that mandate unwalkable city designs is that people drive more, and emit more greenhouse gases from their tailpipes.
Zoning in most Cascadian cities is anti-climate. Single-family zoning—the most sprawling residential zoning type—plasters swaths of the region’s urban areas. Seattle is prime offender: over half of its land is covered by single-family zoning. Bellevue, Bellingham, Eugene, Portland, Salem, and Spokane are similarly strangled by vast single-family zones. And the list could go on.
The consequence of having widespread, outdated zoning laws that mandate unwalkable city designs is that people drive more, and emit more greenhouse gases from their tailpipes. Cars are the largest source of greenhouse gas emissions in Seattle, as in other Cascadian metro areas. Myriad factors influence this relationship. For example, low-density neighborhoods lack the customer base needed to expand transit networks and grow neighborhood walkability via local businesses, reducing opportunities for car-free trips.
Accessory dwelling units (ADUs) could help dial down cities’ climate-busting design with minimal change to the physical form of single-family neighborhoods. These small homes, tucked into existing daylight basements, above garages, or in backyard cottages, make room for more people to join established single-family neighborhoods with very little impact on an area’s look and feel. Added up across the city, these homes nudge up residential convenience and walkability, cutting household driving, and attendant carbon emissions. The additional households bring the riders that support better transit service. They purchase the croissants, handmade cards, and children’s books that keep neighborhood businesses humming and in range of car-free travel options, like biking and walking. In turn, all residents of ADU-rich neighborhoods benefit, enjoying more robust transit, as well as a more thriving local business scene, and of course, the opportunity to make a few more trips car-free.
In this article, I explore the relationship between neighborhood types and household driving behavior and show how ADUs offer single-family neighborhoods a pathway to make a dent in their carbon footprints. ADUs in single-family neighborhoods near city hubs, such as Seattle’s “urban villages,” offer enhanced climate benefits to their residents, making these areas prime targets for these tiny homes. In a sequel to this article I’ll explore a few of the mechanisms by which driving miles decrease when residential vibrancy increases, including how ADUs can support better transit networks, car shares, and local businesses in Seattle.
Single-family zoning , and resulting high vehicle emissions, are trademarks of most of Cascadia’s cities. In these articles I’ll look at Seattle as a case study examining the links between emissions, housing density, and ADU development, but the findings apply across the region.
Welcoming neighborhoods have smaller carbon footprints
Residents of compact neighborhoods drive less. Ever-growing piles of research from Seattle, King County, the Puget Sound region, Washington state, across the United States (also here, here, here, here, here, and here), demonstrate a link between residential density and personal vehicle use. Many studies from the United States as well as other countries, estimate that a doubling of residential density correlates with residents’ cutting their driving miles by 25 to 30 percent. Other reports show variations of this relationship, some stronger, some weaker, but all point to fewer miles behind the wheel in convenient and walkable neighborhoods.
Why Seattleites in certain neighborhoods drive less
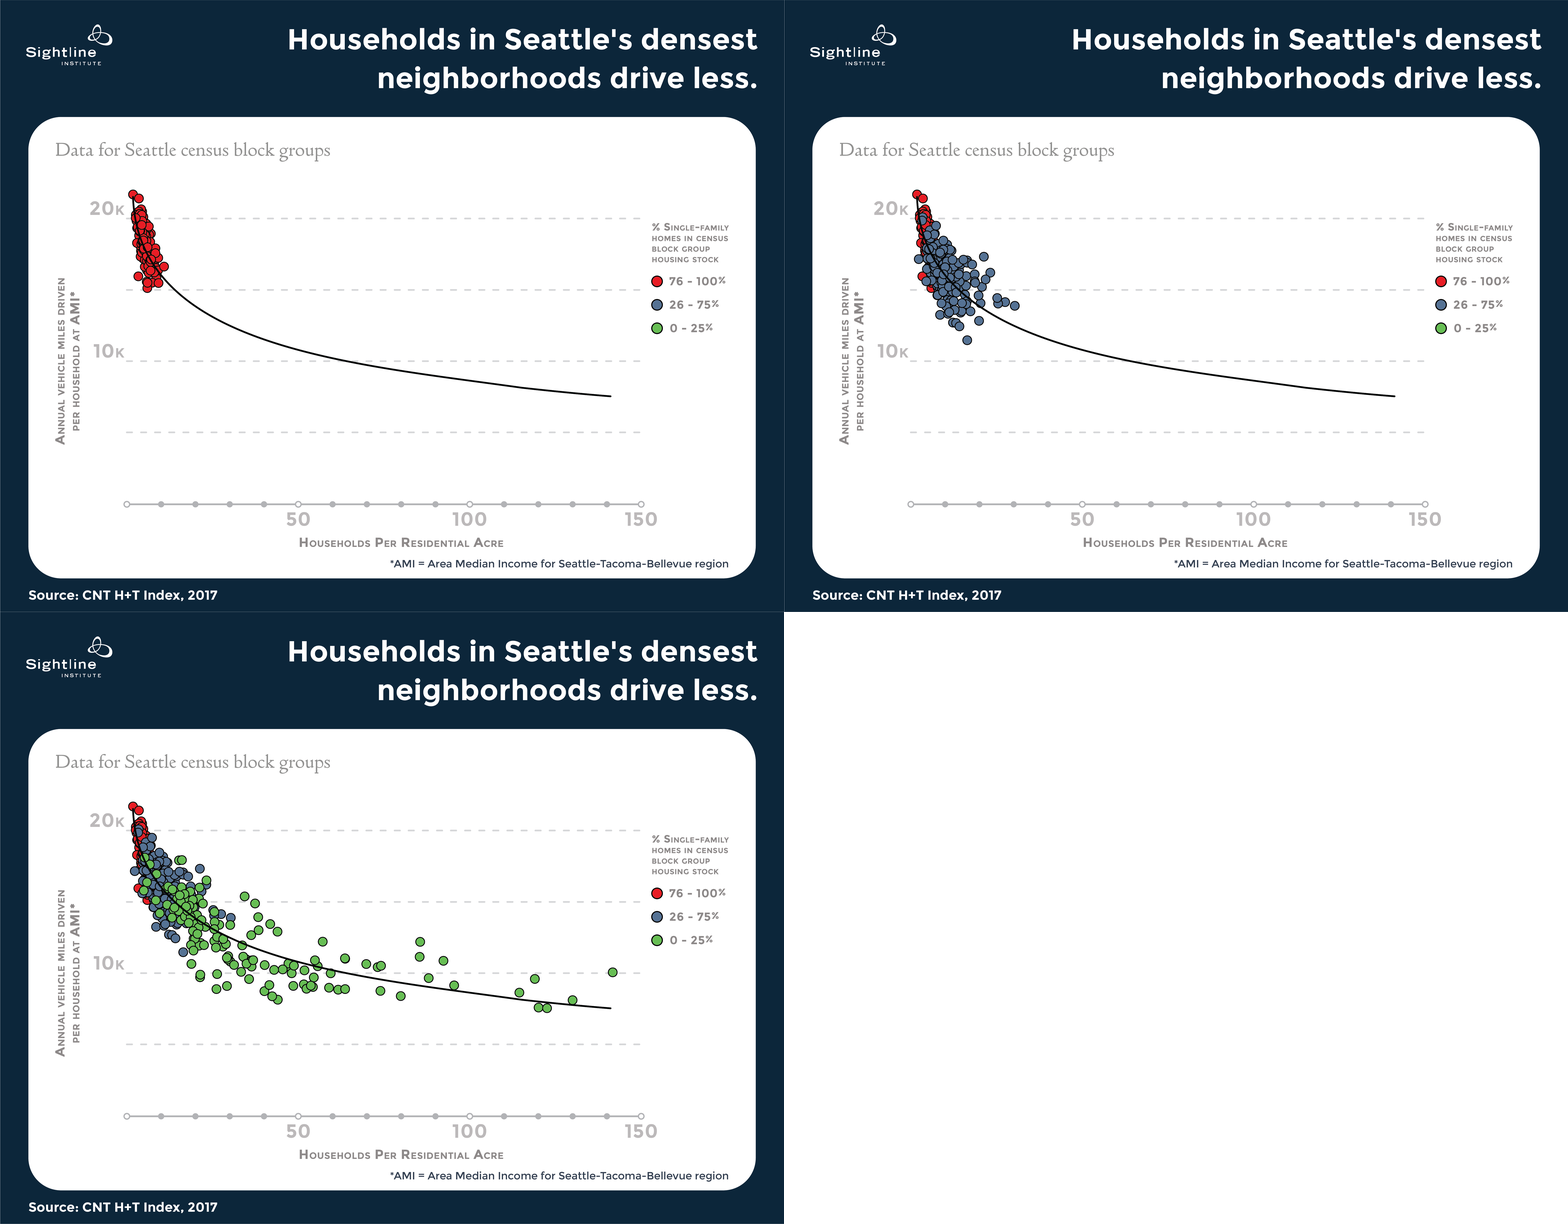
The chart below shows annual household driving estimates for each of Seattle’s census block groups according to a predictive model from the Center for Neighborhood Technology Housing and Transportation Affordability Index (H+T).
CNT’s model estimates household driving behavior in every census block group in the United States using statistical relationships derived from measured driving behavior data in a variety of US urban and rural settings (read more about the model in this methodology guide). The model holds three household characteristics—income, size, and number of commuters—constant across all block groups within the same census core based statistical area. In other words, it compares driving behavior for households of identical income levels—the median regional income—size, and number of commuters. This makes it possible to isolate the impact on driving behavior of 11 neighborhood design characteristics, including employment and transit access, pedestrian friendliness, and the share of single-family homes in the housing stock, share of owner- versus renter-occupied homes in the block group. Overall CNT found that, among households of the same income, size, and commuting levels, household density within a block group was the best predictor of driving habits.
The model predicts that households in Seattle’s most sprawling census block groups—those to the left on the chart—log substantially more miles behind the wheel than those in the city’s more compact block groups, located to the right on the chart.

Not surprisingly, the census block groups on the left side of the chart—those with the lowest residential household density, and highest personal car use—are also more likely to be covered by detached, single-family homes, the housing type that gobbles up the most land per dwelling.
Each marker on the chart is color coded according to the percent of housing units in each census block group that are single-family homes. Red data points represent block groups in which between three-quarters and all of the housing stock is single-family homes. Blue markers indicate block groups in which between one- and three-quarters of the housing stock is single-family homes, and block groups in which single-family homes comprise a quarter or less of the housing stock are represented by green markers. Keep in mind, the results are normalized for area median income, correcting for differences in household behavior based on wealth.
The red colored markers dominate the highest positions on the chart—on average, households in these block groups drive more than 18,000 miles per year—indicating that the block groups with the largest proportion of single-family homes are also some of the most car-dependent areas of the city. On the other end of the spectrum, data points at the lowest points on the chart are exclusively green, showing that block groups with the least single-family housing also drive the least. In fact, households in the green census block groups average just over 12,000 miles behind the wheel per year, 6,000 fewer than their red counterparts.
ADUs could help slide Seattle’s single-family neighborhoods down the gas-guzzling curve
Most of Seattle’s census block groups find themselves in a cluster on the left side of the above chart because the city’s zoning bans anything but single-family houses on over half its land. The preponderance of single-family zoning is like a mandate for a gas-guzzling lifestyle, undercutting Seattle’s greening efforts.
But the chart also shows that households in less walkable neighborhoods—those with fewer than about 20 homes per residential acre—substantially reduce their driving when they welcome just a few additional households per acre. This means that the traffic jam of census block groups on the left side of the chart presents an opportunity for Seattle’s single-family neighborhoods. These communities could markedly reduce their vehicle emissions if they added even a few ADUs per typical neighborhood block.
The chart suggests, by way of a rough estimate, that if a typical Seattle single-family neighborhood block of 21 detached homes added 7 accessory dwelling units, increasing its household density by one-third, it might reduce its average driving by about 1,000 miles per year, per household. Of course, the impacts of increased residential density aren’t typically noticeable on a block level. They become more obvious with wider adoption, across a neighborhood or larger area of a city.
Proximity to walkable neighborhoods also reduces driving
Residential density at the local, neighborhood scale is, of course, not the only factor that influences driving behavior. Another one that is just as important, and sometimes even more so, is the density of the surrounding area. Even if a given neighborhood is relatively sparse, the closer it is to other high-residential areas, the less residents drive. High-residential areas typically also have more job centers, transit, and other destinations, giving residents of nearby neighborhoods easy access to these amenities, and the opportunity for shorter, and more car-free, trips. Adding ADUs to neighborhoods that are close to higher density zones yields even more bang for the buck than adding them to other neighborhoods, in terms of climate pollution reduction.
The CNT H+T model includes a metric—household gravity—to measure residential density surrounding each US census block group. (Read more about how CNT developed this metric in the notes section below, and on page eight of the H+T Index methodology document.)
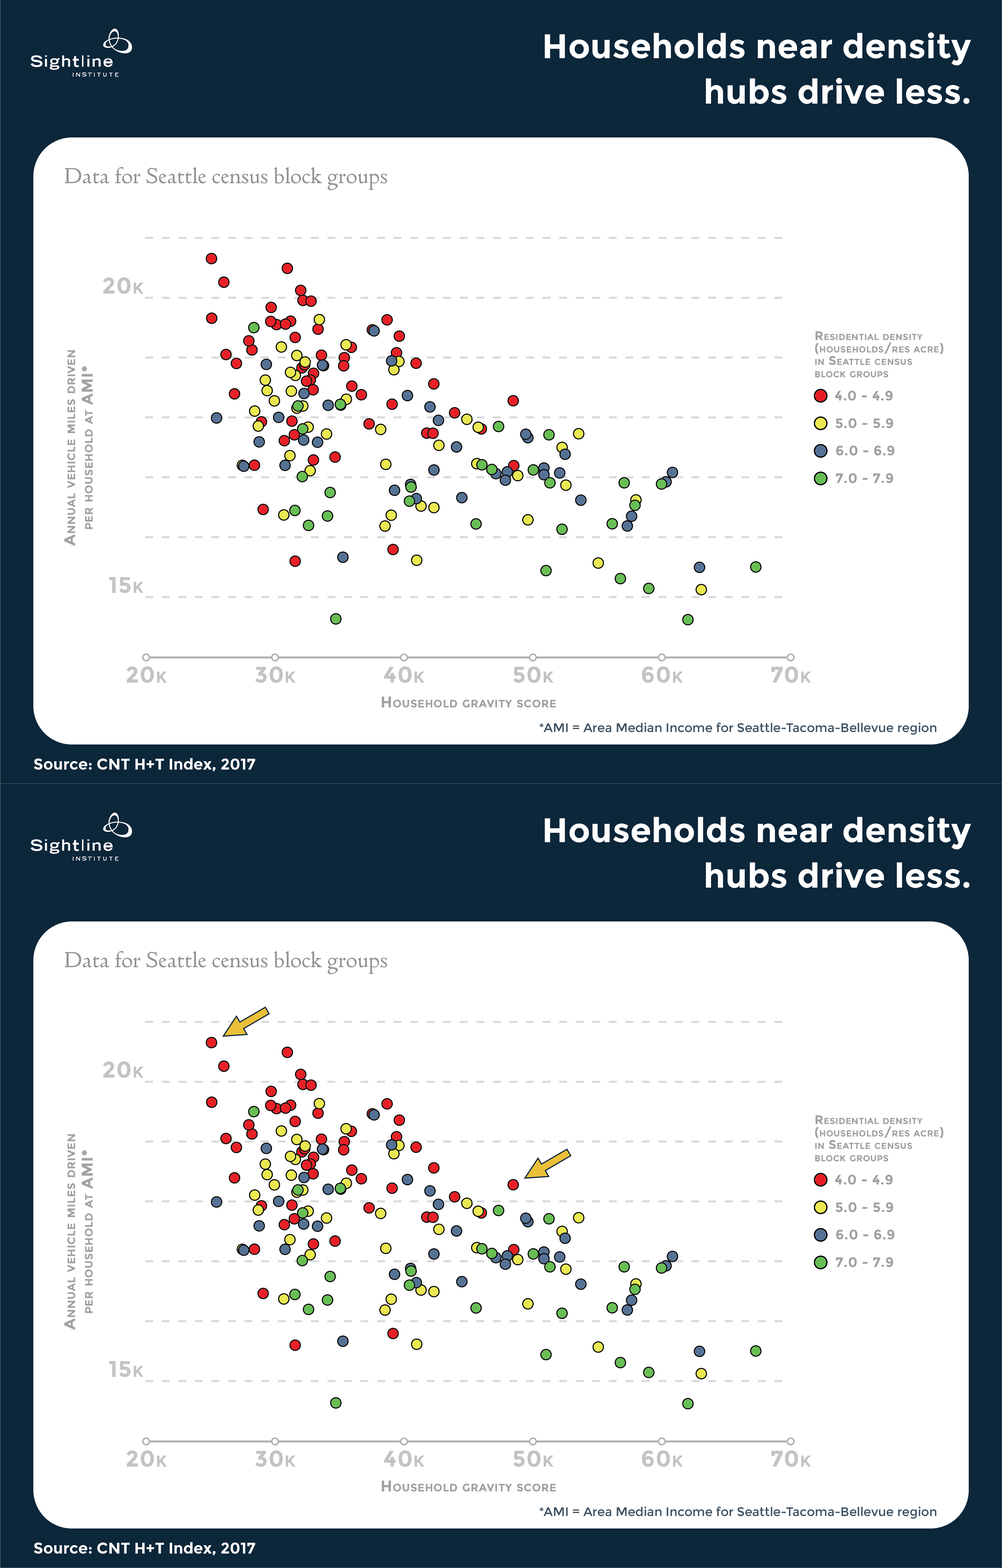
The chart below shows the CNT H+T model’s predictions for household annual driving miles in each Seattle census block group that features between 4 and 8 households per residential acre. The overall trend I showed above, of less driving in more walkable areas, persists on this graph: the red circles, representing the lower density census block groups in the sample, are generally higher on the chart than the green ones, which represent the block groups with the highest densities in the sample. But, the model also predicts another trend: residents of block groups with nearly identical residential densities have somewhat different driving behavior based on household gravity, or proximity to denser areas. In other words, between two neighborhoods of similar densities, residents of the one closer to higher density areas will drive less.

Here is an example: the red circle in the uppermost left corner of the chart (with the upper arrow pointing to it), represents a census block group in Seattle’s Arbor Heights neighborhood. The block group is entirely covered and surrounded on all sides by single-family zoning. It has 4.18 households per residential acre and a gravity score of just over 25,000. The H+T model predicts that average-sized households in this neighborhood at the area median income drive nearly 21,000 miles per year in their personal cars.
Meanwhile, the red circle in the middle of the chart, with the lower arrow, is also covered entirely by single-family zoning and has 4.4 households per residential acre, only a breath denser than the Arbor Heights neighborhood. Yet the model predicts that households in this neighborhood drive 2,000 fewer miles per year than their counterparts in Arbor Heights. The difference: unlike the Arbor Heights neighborhood, this one is located a short walk from the Roosevelt urban village boundary and the busy commercial strip along Lake City Way. Residents of this neighborhood are within a short bike ride or walk from a grocery store, gastropub, several restaurants, diners, and coffee shops, as well as several bus lines.
Both neighborhoods could benefit from the addition of some new ADUs. But between the two, the new households in the Roosevelt neighborhood would enjoy additional walkability because of their proximity to the nearby commercial centers. Seattle has 30 urban villages (including urban centers, hub, and residential urban villages) scattered throughout the city and adjacent to single-family zones, offering lots of opportunities for single-family homeowners to take advantage of the additional climate benefits of ADU development in these areas.
ADUs reduce regional driving, too
In addition to the climate benefits ADUs bring to all residents of the single-family neighborhoods they join, these small homes cut regional driving in another way, too. Where would Seattle’s ADU households live if their homes had never been built? Much of the regional housing stock with a similar size and price point of a typical Seattle ADU is located outside of the city limits, in moderately priced areas such as Renton, Kent, and Burien. So, in the absence of an ADU, many of these households might settle outside the city entirely, taking on longer work commutes and driving time for typical household errands.
ADUs offer an easy means to reduce Seattle’s carbon footprint
Households in the city’s lowest density neighborhoods, those covered predominantly by single-family houses, tend to drive the most and contribute disproportionately to Seattle’s carbon footprint. Accessory dwelling units can breathe new life into these neighborhoods—adding households that support better transit and a more thriving local business scene, both of which help all residents reduce their fuel consumption. Because driving is also influenced by surrounding density, ADUs in single-family neighborhoods near Seattle’s urban villages would offer more households even better opportunity to live car-lite.
Despite the climate benefits that ADUs would bring to the region, cumbersome municipal policies—like parking requirements, owner occupancy regulations, one ADU per lot limits, and restrictive construction specifications—obstruct many Cascadians’ opportunities to add these small homes to their neighborhoods. These policy barriers keep ADU construction in Seattle to a trickle, undercutting the region’s stated commitments to reducing emissions and fighting climate change.
Seattle and other Cascadian cities can clip these overbearing rules from their books and allow this carbon-cutting housing option to spring to life across the region. Seattleites will have the opportunity to do just that later this year when their city council considers removing some of these obstacles from its municipal code. Eliminating the laws that hamper ADU construction in the Emerald City would boost the city’s green housing stock, and serve as an affirmation of the city’s commitment to climate-conscious growth.
In my next article I’ll outline three concrete ways ADUs can support car-lite living in Seattle and across Cascadia.
Notes on methods
The CNT Housing + Transportation Affordability Index (H+T) model I reference in this article is a statistical model based on empirical data from diverse communities in Illinois, including the Chicago and St. Louis metro areas. Based on that data the model extrapolates driving behavior under a range of conditions in all other census block groups in the US, including those in Seattle. The model holds three household characteristics—household size, income, and number of commuters—constant for all households within the same US Census Core Based Statistical Area (CBSA) in order to isolate the impact of neighborhood design on driving behavior.
The model measured the impact of 11 neighborhood design characteristics to determine the influence of each on residents’ driving behavior. Overall it showed that residential density—measured by either households per residential acre, or regional household intensity—was the best predictor of driving habits. Household density often correlates with some of the other variables; for example, denser areas are also more likely to have high job and transit access. As a result, it’s difficult to tell the specific causes of driving behavior change, but it is clear that household density is nearly always a part of the recipe.
You can read more about the model’s design in this methodology document.
To develop the chart tracking household annual driving miles across residential density of Seattle’s census block groups I removed the two census block groups that have fewer than 100 total households. Both covered the the University of Washington campus.
CNT’s household gravity score assigns each US census block group a gravity score based on proximity to all other households in the US: the closer it is to other households, the higher the gravity score. Households closer to the census block contribute a lot to the score, while households several miles away from the block group influence the gravity score very little. Read more about the formula CNT used to calculate gravity scores on page eight of their methodology document.


Comments are closed.