[button link='{“url”:”http://www.sightline.org/2017/06/06/map-the-future-is-carbon-priced-and-the-us-is-getting-left-behind/”,”title”:”Click here for an updated version of this map”}’]
Editor’s note: We updated this map in 2017—you can see it here.
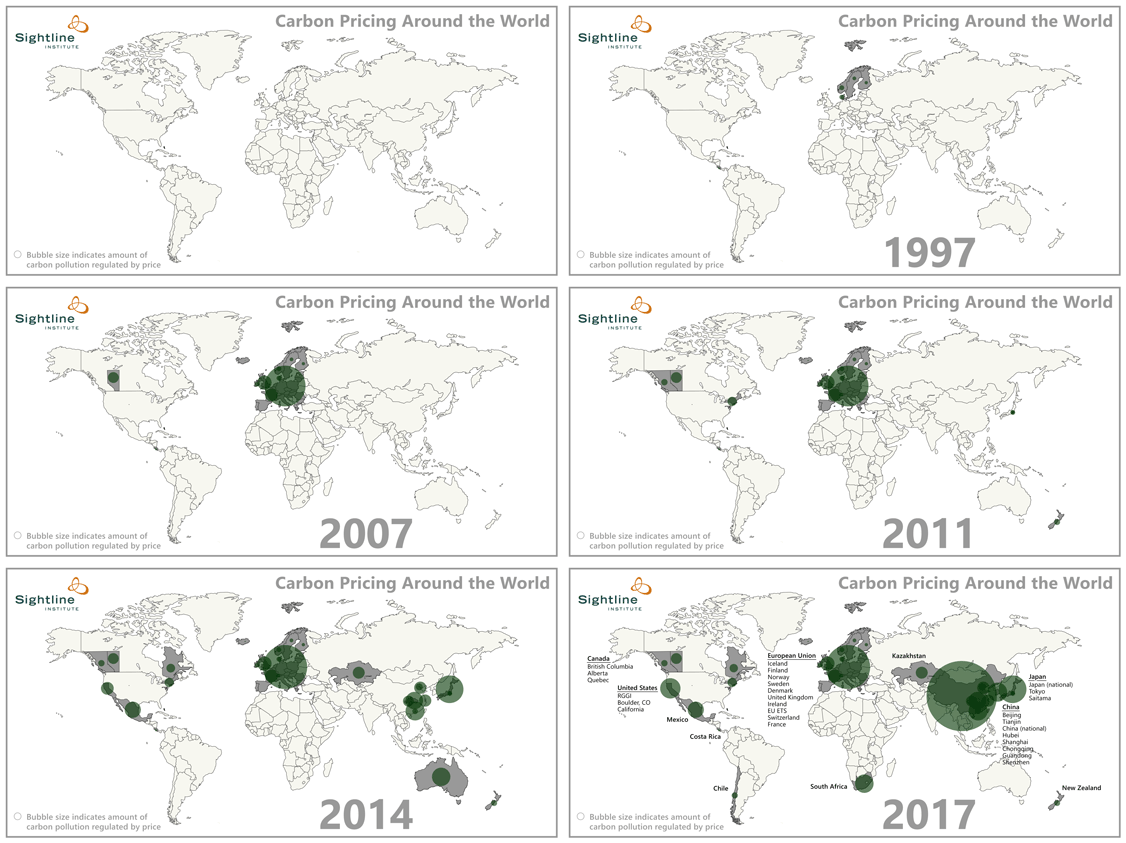
Oregon and Washington leaders are contemplating turbocharging their clean energy transition by instituting carbon pricing here in the Pacific Northwest. Will a cap or tax on carbon work? Has anyone else ever done this before? Why, yes. Since you ask: Scandinavian countries have been pricing carbon for more than two decades. The European Union Emissions Trading System (EU ETS) has been pricing carbon for almost a decade. US states and Canadian provinces have been pricing for years. Today, there are 39 (1) different programs that collectively put a price on 12 percent of all the greenhouse gas (GHG) emissions in the world. And when China’s national program starts in 2016, almost a quarter of global GHG pollution will carry a price tag to speed the changeover to clean energy. The animated map below shows carbon pricing programs around the world, with the size of the bubbles indicating the amount of pollution priced.

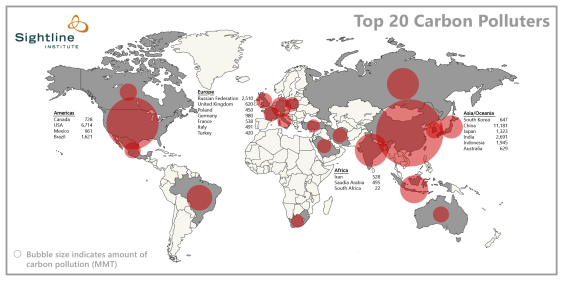
Carbon pricing programs come in many flavors: tax, cap-and-trade, or hybrids, and implemented at the level of country, region, state, or even city. (A fully sort-able table of the programs is at the bottom of this article.) The biggest program is the EU ETS, covering a little less than 2,000 million metric tons (MMT) of GHG emissions, or about 45 percent of all the emissions in the European Union. Japan’s carbon tax is the next biggest player, covering about 800 MMT, or 70 percent of Japan’s emissions. China, with several years of pilot project experience under its belt, is now committed to rolling out a cap-and-trade program in 2016 that will dwarf both the EU and Japan’s programs, probably covering about 5,000 MMT of pollution. For reference: the entire world emits about 36,000 MMT, so China’s program alone will price about 13 percent of global emissions. To get a sense of how the carbon pricing programs relate to global emissions, the map below shows the world’s biggest polluters. (You can also see countries re-sized by emissions here.) The US has a conspicuous mismatch between its large red pollution bubble and the lack of a green price bubble. President Obama, not to be outdone by the Chinese, has announced an agreement with China to cut carbon pollution. However, new Congressional leadership has vowed to move in the opposite direction by delaying and undermining federal efforts to cut pollution.

Here are a few questions about global carbon pricing programs that Pacific Northwest leaders might want answered:
1) How high is the carbon price?
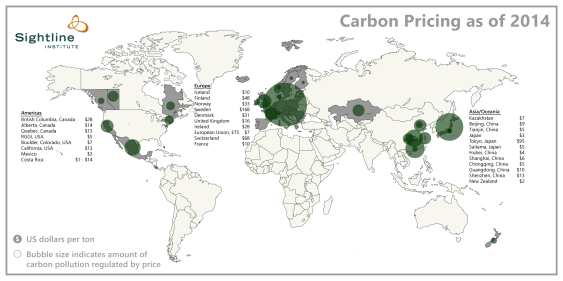
Prices range from $1 to $168 per ton, but most cluster between $10 and $30 per ton. For example, California’s price is currently around $13 per ton, and British Columbia’s price is currently around $28. The price outlier at $168 per ton is Sweden, where a high and persistent price has helped reduce pollution 13 percent in a decade. A carbon tax of $28 plus other policies have helped Ireland slash pollution more than 15 percent since 2008. This map shows current prices around the world.

2) How do they set the cap or tax?
Most cap programs aim to return to their own 1990 levels of pollution within 10-15 years. For example: California wants to get back to 1990 levels by 2020, New Zealand aims to reduce 5 percent below 1990 by 2020, and South Korea’s target is 4 percent below 2005 levels by 2020. China aims to reduce its carbon intensity 40-45 percent below 2005 levels by 2020.
Economists recommend setting a tax based on the social cost of carbon—the cost that carbon pollution imposes on our economy, and therefore the appropriate price that polluters should pay. The US Environmental Protection Agency (EPA) estimates that the social cost of carbon is around $39 per ton, and you can argue the number higher or lower. For now, though, a price starting around $30 per ton would put Oregon or Washington in line with other programs and close to the economist-approved price.
3) What is the program’s scope?
Most carbon pollution comes from burning fossil fuels to generate electricity, to power businesses, to heat buildings, or to transport goods and people. Landfills don’t burn fossil fuels, but they do spew methane pollution, a potent greenhouse gas. How to decide what pollution to include?
Almost all programs price pollution from electricity. An important question when pricing pollution from electricity is whether to price the power generated in the state (like RGGI and British Columbia), or the power used in the state (like California and Quebec). In the Pacific Northwest, many homes and businesses use power produced by coal plants outside the state: Oregon gets a third of its power from coal, and Washington gets 13 percent from coal. Most of that power—and soon all of it—comes from out-of-state plants.
Almost all programs price pollution from large industrial sources: usually only those that exude more than about 25,000 metric ton (MT) of carbon dioxide equivalent (C02e) per year. For example, California, Quebec, and Korea’s programs only include facilities with more than 25,000 MT C02e per year. Kazakhstan sets the threshold at 20,000 MT, and the Canadian province of Alberta only covers firms with more than 100,000 MT per year. Setting a threshold insures that mom-and-pop shops do not pay the carbon price and that auditors only need to check up on a relatively small number of big businesses. For example, a 25,000 MT threshold would mean only about 48 businesses in Oregon and about 83 businesses in Washington would pay a carbon price. If the threshold were lowered to 10,000 MT, then still only 49 Oregon businesses and 85 Washington businesses would pay.
Less than half the global programs price transportation pollution. This is partly because transportation is often not a very big piece of the pie—in the EU, transportation accounts for only 20 percent of GHG emissions, and in South Africa it is just 9 percent, compared to 45 percent in Washington and 36 percent in Oregon. And it is partly because air quality agencies often already have experience regulating “stationary sources” such as power plants and factories but don’t have the same experience with “mobile sources” such as cars and trucks. Like Oregon and Washington, transportation is the biggest contributor to emissions in California, so those emissions will be priced starting in 2015. Rather than price the pollution coming out of every tailpipe in the state, California priced carbon at the refinery.
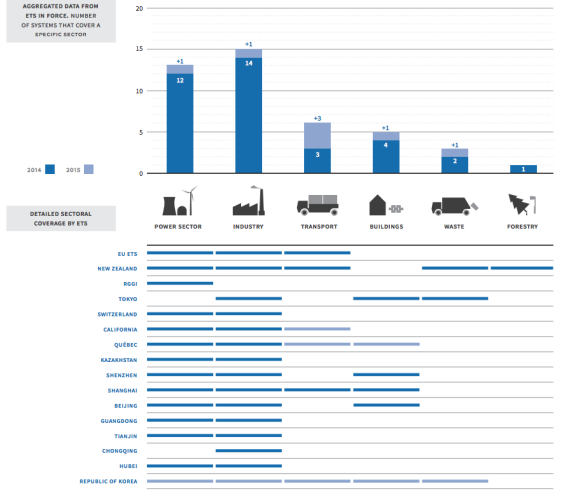
Local or regional programs often do not have the authority to price pollution from electricity, so they instead price pollution associated with buildings in order to encourage more efficient use of resources within their borders. The graphic below shows a collection of carbon pricing programs, illustrating that most price the power and industrial sectors (first two columns), some price transportation and buildings (middle two columns), and a few also price waste and forestry (far right columns).

4) What do they do with the revenue?
Everyone has ideas for how to spend money. The money is important not only for political wrangling, but also for the effectiveness of the program. Spending the money on local cost-effective carbon reductions—as most RGGI states have done—helps keep the carbon price down by capturing low-cost reductions, and it also boosts the local economy. While a price on carbon sends the right signal to the private sector to direct investments towards low-carbon solutions, a price alone is not enough, and may even leave money-saving options on the table. That is because many pollution-cutting options (mostly energy efficiency improvements) are cost-effective even without a carbon price, but other market barriers block them. Using some of the money from a carbon price to pick this low-hanging fruit saves money and creates local jobs. By spending the money on energy efficiency, the nine RGGI states are set to add $8 billion—with a b—in net benefits to their local economies by 2020. Ireland has also invested some of its carbon tax in energy efficiency and local jobs. Costa Rica uses its carbon tax money to pay landowners to grow trees that further trim Costa Rica’s emissions.
Spending carbon revenue in ways that help low-income people–as California is planning to do with some of its money—prevents the price from being regressive.
Using the money to cut other taxes—as British Columbia’s revenue-neutral carbon tax does—can reduce the tax burden on workers and employers. British Columbia has reduced personal income tax and business taxes by $5.7 billion over the past 6 years. Ireland has also used some of its carbon tax to replace some income tax.
[button link='{“url”:”http://www.sightline.org/2014/03/11/all-you-need-to-know-about-bcs-carbon-tax-shift-in-five-charts/”,”title”:”Learn all about BC|apos;s carbon tax shift in 5 handy charts.”}’ color=”green”]
Be warned: cap-and-trade programs that give the allowances away for free have no money to spend. Cap programs can either auction the allowances to polluters and collect the money, or give the allowances to the polluters for free and collect no money. Some programs start out with a lot of free allowances to help give a soft start to the program, but most—for example, the EU, New Zealand, Korea, Kazakhstan—wean themselves off free allowances and shift to auctioning over time. In 2013, the EU started auctioning almost all allowances in the power sector and will phase down free allocation in others sectors to 30 percent by 2020. Some—for example, RGGI— auction almost all allowances from the start.
5) How do they address competitiveness issues?
Pricing carbon in one state or country can make it hard for local carbon-intensive companies to compete with companies from states or countries that don’t have a carbon price. To keep local carbon-intensive companies competitive, most programs try to identify and assist industries that face large price increases from a carbon price and also face competition from outside the state or country. Although only a few industries in Oregon and Washington would see a carbon price impact of more than 5 percent, those that are both carbon-intensive and trade-exposed will need assistance. The most common way to assist these industries is to give them a tax break—as Denmark does—or free cap-and-trade allowances.
Some cap programs use a sledgehammer approach and simply give away all the allowances for free. But, as the EU learned, free allocation can lead to windfalls for some industries that are able to pass the costs along to customers and pocket the difference. The more sophisticated programs use a scalpel approach and identify the industries that are vulnerable and then use an industry-specific benchmark when targeting those for assistance. For example, California and the EU both set benchmarks based on the top 10 percent of the industry: those top factories will get all of their allowances free, but more-wasteful factories will only get allowances to cover how much they would emit if they were as efficient as the top performers. This policy rewards high performers within the industry and gives laggards a kick in the pants.
In Oregon, the industries that might deserve protection include producers of cement, lime, pulp and fertilizer. Together, these vulnerable industries account for 0.2 percent of jobs in Oregon. In Washington, the metal manufacturers and possibly cement, lime, gypsum and glass industries would likely deserve protection.
6) How do they monitor, report, and verify carbon pollution?
A price on pollution doesn’t do much to speed the transition to clean energy if you don’t know how much carbon polluters are releasing. Some countries, including China, may have difficulty collecting reliable data about emissions. China’s pilot carbon trading programs are developing better methods for and understanding of monitoring, reporting, and verification (MRV). Even the EU started out without good data and had to change course later. The best programs start with third-party verified emissions reporting and tracking systems from the outset. Oregon and Washington already have self-reporting programs in place but might want to add third party verification.
7) What’s better: a cap or a tax?
Wrong question. What matters are those pesky details. A well-designed tax can deliver the same benefits as a well-designed cap. Poor design can ruin either.
8) Does anyone do both?
Several countries use both a cap and a tax. For example, Ireland taxes the sectors that are not covered by the EU ETS cap. Or, a tax can double up with a cap to increase the price in sectors that need a higher price to motivate long-term investments. For example, a carbon tax could be added on top of a cap in the transportation sector to motivate the infrastructure investments needed to provide true low-carbon options—extensive public transit, walk-able and bike-able land use, and new mobility options—in that sector. Both programs send a price signal that will spur the transition to a clean energy economy, but they can be mixed and matched to meet a state or country’s specific goals. Switzerland designed its tax to act like a cap, self-adjusting to make sure it cuts pollution to certain levels.
Almost a quarter of all greenhouse gas pollution being spewed around the world is being, or soon will be, driven down by a price. I mean, Kazakhstan is doing it! Maybe it’s time for Oregon and Washington to join the post-carbon transition.
| Jurisdiction | % MMT Covered | Country’s MMT Co2e 2012 | MMT Covered by Price | Year Implemented |
|---|---|---|---|---|
| China | 50 | 10,563 | 5,282 | 2016 |
| EU ETS | 45 | 3,967 | 1,785 | 2005 |
| Japan | 70 | 1,170 | 819 | 2012 |
| Hubei, China | 35 | 926 | 324 | 2014 |
| Guangdong, China | 42 | 924 | 388 | 2013 |
| Mexico | 40 | 700 | 280 | 2014 |
| South Korea | 60 | 655 | 393 | 2015 |
| Australia | 60 | 600 | 360 | 2012 |
| United Kingdom | 40 | 543 | 217 | 2001 |
| California, USA | 35 | 497 | 174 | 2012 |
| France | 35 | 487 | 170 | 2005 |
| South Africa | 80 | 457 | 366 | 2016 |
| RGGI, USA | 22 | 414 | 91 | 2009 |
| Chongqing, China | 38 | 329 | 125 | 2014 |
| Shanghai, China | 50 | 320 | 160 | 2013 |
| Kazakhstan | 50 | 303 | 151 | 2013 |
| Tianjin, China | 60 | 267 | 160 | 2013 |
| Alberta, Canada | 50 | 249 | 125 | 2007 |
| Saitama, Japan | 16 | 106 | 17 | 2011 |
| Chile | 40 | 101 | 40 | 2017 |
| Beijing, China | 50 | 100 | 50 | 2013 |
| Quebec, Canada | 30 | 88 | 26 | 2013 |
| Shenzhen, China | 38 | 87 | 33 | 2013 |
| Finland | 15 | 76 | 11 | 1990 |
| New Zealand | 50 | 71 | 36 | 2008 |
| British Columbia, Canada | 70 | 61 | 43 | 2008 |
| Sweden | 25 | 60 | 15 | 1991 |
| Tokyo, Japan | 40 | 60 | 24 | 2010 |
| Ireland | 40 | 57 | 23 | 2005 |
| Denmark | 45 | 54 | 24 | 1992 |
| Norway | 50 | 50 | 25 | 1991 |
| Switzerland | 30 | 50 | 15 | 2008 |
| Costa Rica | 85 | 15 | 13 | 1997 |
| Iceland | 50 | 3 | 1 | 2005 |
| Boulder, CO, USA | 50 | 0 | 0 | 2007 |


Comments are closed.