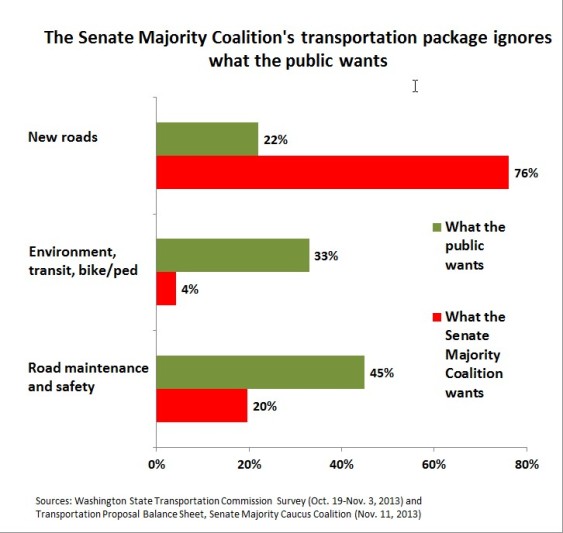
Last week, we argued that the rest of Washington State should simply walk away from a $12.3 billion transportation package being floated by the Senate Majority Coalition Caucus. This chart explains why: Its priorities are exactly the reverse of what people say they want.
A new public survey from the Washington State Transportation Commission released last Friday offers a reality check on negotiations underway in Olympia about what new transportation investments should look like. The survey actually asked people if they had 100 points to devote to transportation priorities—or in this case, let’s call it a dollar—how would they want to spend it?
The public favors a balanced transportation system. State residents would opt to spend 29 cents of every dollar on maintaining our current transportation system; followed by 22 cents on building or expanding roads and other capacity; 20 cents on expanding travel options through transit, bike, pedestrian, and HOV projects; 16 cents on increasing safety; and 13 cents on reducing pollution and boosting environmental benefits.
By contrast, how would the Washington Senate Majority Coalition Caucus leaders spend each dollar generated by an 11.5-cent gas tax increase they’ve proposed? By spending 3 times more money on highway expansions and new roads than their constituents say they want.
Given the same priorities, their transportation package would spend a whopping 76 cents of every dollar on building or expanding highways and roads, plus a tiny bit of new ferry capacity. That leaves precious little left over for everything else. In the most generous analysis possible, their transportation package would spend 17 cents on maintenance, 2 cents on safety, less than 2 cents on transit/bike/pedestrian projects, and arguably 2 cents on environmental benefits (more on that in the notes below).
Ironically, the Majority Coalition Caucus made up of Senate Republicans and led by Sen. Rodney Tom came up with its proposed transportation package after a much touted “listening tour” of the state. Clearly, they weren’t listening very well.
Notes on Methodology:
The Washington State Transportation Commission initially published incorrect numbers in response to some portions of question 6 of the survey. We have updated the post and chart with the latest numbers, which only differ by one or two percentage points and do not substantially change the comparison.
To arrive at percentages in the Senate Majority Coalition proposal, we included the following line items from their Transportation Proposal Balance Sheet in the following categories. In the interest of fairness, we tried to assign credit wherever possible to non-capacity-related categories, and assumed only 40 percent of local distributions would be used for road building. In reality, the MCC proposal would likely focus a greater share of its resources on highway building than our analysis shows:
- Improving capacity: Improvement projects (highway and road), a new ferry, debt service, and 40 percent of direct distributions to cities and counties.
- Maintenance: Highway preservation, facilities, traffic operations, new ferry terminals, county road improvement board funding, 60 percent of direct distribution to cities and counties.
- Safety: Any highway improvement project with the word “safety” prioritized in the title and Washington State Patrol funding.
- Transit/bikes/pedestrian projects: Grants for transit, vanpool, bicycle, and pedestrian projects, Safe Routes to Schools + Complete Streets
- Environment: The Senate Majority Coalition Caucus proposal would actually spend zero money from the gas tax increase on environmental benefits. It eliminated funding for culverts that help fish safely navigate roads and would pay for stormwater projects from a state fund that’s supposed to help clean up toxic sites.
About 5 percent of the Senate Majority Coalition Caucus proposal would fund priorities that are not specifically mentioned in the public survey, such as freight mobility.


John Niles
The post above is based on numerical manipulation that doesn’t bear on the message being delivered.
I’m one of 5,673 people who voluntarily signed up for the Transportation Commission’s “Voices of Washington” panel survey that is the data source for “what the public wants” in the above essay.
On one question, number 6, we were asked to move a “slider bar” on a computer screen to allocate a percentage of “transportation system” focus across five intergovernmental transportation system objectives, so that the five allocations added up to 100%.
The results of this process of data collection cannot — I repeat, cannot — be taken to represent “what the public wants” in a statewide budget allocation.
For one thing, question 6 did not mention the word “budget.”
Second, the question conflated transportation systems “focus” by all levels of government: WSDOT, counties, and cities. And it mashed up urban and rural.
Third, focus importance does not equal budget in government. Something can be very important for taxes to pay for, but that doesn’t mean it deserves a lot of money. We want important things, indeed all things that that government does, to be done efficiently, because governments have lots of different things to do.
One could give “expanding travel options” a focus rating of 30% in a transportation system without thinking that 30% of the state transportation budget should go to “transit, bike/ped.”
Here’s the exact question wording that the above analysis wants to link to a WSDOT budget allocation:
“Our transportation system is designed to meet a number of objectives. If you had 100 points to divide between the five objectives below, how many points would you assign to each objective? (For example, if you move the slider bar to 25 for “improving safety” that means you think “improving safety” should get 25% of the focus. The total for the 5 objectives should add up to 100 points.)”
As a related point on the pending transportation package, I can’t understand why Sightline would not want our State to implement a 11.5 cents per gallon gas tax, or even more — wouldn’t that increment amount to a carbon tax? Eleven and 1/2 cents more per gallon on gasoline is equivalent to a carbon tax on that part of our carbon of $13 per metric ton.
Jennifer Langston
Yes, we are certainly supportive of making investments in our transportation system. We just believe they should better reflect the public’s priorities, which is what the survey asked about.
John Niles
I forgot to mention in my comment above that the self-selected respondents to the State survey may not be a scientific sample that is representative of the general public. Supposedly there is some weighting involved of responses in the published result, but I couldn’t find the details in the backup material.
Deric
Sarah this is an excellent illustration of of the misguided priorities of the leadership in the Senate. I took the survey as well and I think this is a completely fair analysis. John your arguments are arbitrary does nothing to discredit the foundation of Jennifer’s point about the public’s priorities.
John Niles
The Senate Majority Coalition may not have the overall Washington State voters’ priorities in mind (whatever that means), even though I’m sure these legislators think they are listening to their constituents.
My point in writing these comments is that the original post above that contrasts sets of numbers derived after processing from two quite different data sources does not fairly illustrate a mismatch of public and Senate priorities.
Let me provide more illustration of my point. The graphic above has a category called “Environment, transit, bike/ped.” After some arithmetic that is well described, the rating for “what the public wants” comes out to be 33% and for “what the Senate Majority Coalition wants” is rated 4%.
For all the reasons I documented above, this contrast of 33 vs 4 coming from two different places is numerology that does not bear on the point being made in the headline, that the public cares a lot about “environment, transit, bike/ped” and the Senators in the Majority Coalition Caucus do not.
To further illustrate my contention, note the results on public opinion from different questions in the same survey. For example, look at the ratings of what the respondents say about “importance” for various “transportation components,” in questions 14 through 17.
“Widening and building more roads and highways” rates 3.09 on a 5-point scale by the public taking the poll, higher than “Building bike lanes” at 2.40 and “Building or improving sidewalks” at 2.84.
Now “Expanding public transit services like buses, vanpools, and dial-a-ride” comes in at 3.31 “importance” on a 5-point scale, but this does not mean the public thinks state funding of public transit should receive more funds than road building (3.09), because that wasn’t asked. Furthermore, the question was about components of the entire transportation system as provided by all levels of government, not just Washington State DOT.
Here’s a clue: Perhaps the Senators in gauging priorities looked at the market share of the various uses of the overall transportation system by the public that were measured in question 28:
“28. Please think about all the trips you make from home during a typical week such as going to work, running errands, or going to appointments. Approximately what percentage of those trips per week are done by:
28_1. Driving alone in your vehicle… 55%
28_2. Carpooling or driving with someone else… 23%
28_3. Riding public transit… 12%
28_4. Riding a motorcycle… 1%
28_5. Riding a bicycle or walking instead of driving or taking transit… 7%
28_6. Traveling some other way… 2% ”
From arithmetic with just these numbers I’m seeing 79 to 21 as the public interest for roads vs ped/bikes, though to be sure that doesn’t need to match the split on how tax dollars are spent.
John Niles
Congratulations. The whacked out comparison of limes and apples in the above graphic is now being used by the Environmental Policies Coalition in their campaign http://hosted.verticalresponse.com/815515/a8f9885bf4/1464704287/d39e0d9b85/ to have citizens push back on the proposed 11 and 1/2 cent per gallon tax on our state’s single biggest sources of carbon emissions, all because of unhappiness that it funds too many road network improvements to serve our buses, marine ports, construction industry, and grocery stores, in addition to the dreaded cars that most people have.
Bob Hollowell
Believe me, Seattle campaigners for the Monorail Project, 10 years ago, know all about elected officials who thumb their noses at the voters. Fortunately, all but three of that gang have been replaced.
Jennifer Langston
John – our analysis used the simplest survey question aimed at gathering information about the public’s transportation priorities. Trying to divine what the public’s priorities actually are by parsing other answers seems unnecessarily complicated when the survey actually asked a pretty direct question along those lines.
I would argue that a budget or revenue-spending proposal is (or should be) a reflection of public priorities, so, to me, the comparison seems fair. And, leaving spending on bike/ped/transit spending aside, it’s clear that there’s a crying need to better maintain roads and bridges in the state’s local communities and the Senate MCC proposal also underinvests in maintenance in favor of expansion and road building.
Wells
Public surveys, public hearings, even the public vote, are mere formalities to give the impression the public has a say in how corporate assholes profit by converting pristine nature into industrial toilets. No public agency is more subservient to corporate interests nor as malevolently corrupt as those that portend to honestly manage highways, trans-port and mass transit. Seattle is doomed.
Greg Nelson
What’s this nonsense of Safety, Environmental, and bike/pedestrian traffic being “our” priority?? I think I speak for the majority when I say I don’t want my wife to deal with an hour and a half commute to go what should be 15 minutes!!! Our stupid car pool lanes and dumb priorities in this state are blocking up the highways so we can’t get to work. How about the expansion of highways and better use of them. And more common sense in our DOT who seem to block up traffic intentionally all the time to try to make a case for more of our tax dollars??. The whole climate change thing is screwing up our commutes because while all you liberals sit around philosophizing about saving the planet (which is much more engineered and imaginary than real) you are screwing up our priorities and the things we really need. In real life.
Jennifer Langston
We didn’t invent these priorities. We shared how the 5,673 Washington residents who participated in a statewide survey said they wished to focus limited transportation resources. So, clearly, not nonsense to most people.