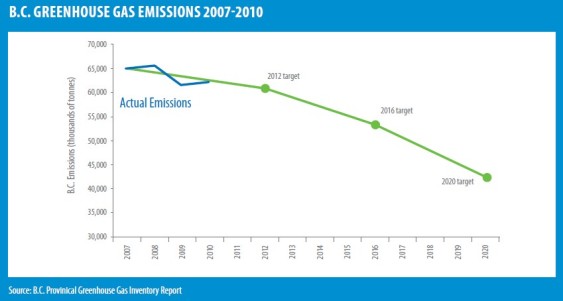
If you only want to know three things about British Columbia’s carbon tax, here’s what they should be. First:
BC’s carbon tax, while still young, is helping the province reduce its greenhouse gas emissions consistent with its targets.
Second:
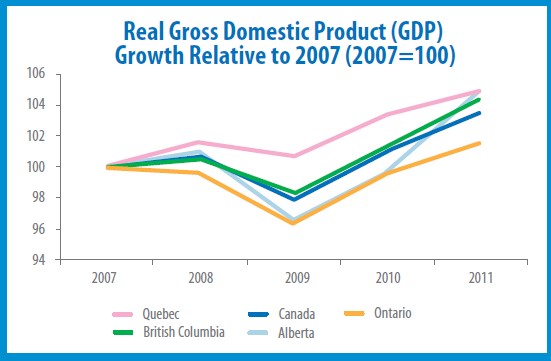
BC’s carbon tax has been correlated with a GDP growth rate higher than Canada’s as a whole. (Compare the green line with the dark blue line.) Combined with the province’s emissions reductions, this is what it looks like to de-carbonize a growing economy.
Third:
BC’s carbon tax is genuinely “revenue neutral,” meaning that for every dollar the government raises by pricing carbon emissions it returns a dollar in the form of tax cuts. It’s a perfect example of shifting taxes from things we want more of—like personal income and business production—to things we want less of—like carbon emissions.
Needless to say, there really is a lot more you should know about how BC’s carbon tax works (and what it can do better). One good place to start is something Sightline wrote recently, “Deciphering the Impacts of BC’s Carbon Tax,” which takes a much closer look at what we know about how the carbon tax has fared since its inception in 2008. The upshot is that things look pretty good.
Here are three other important sources:
- Sightline: Making BC’s Carbon Tax Even Better
- Province of British Columbia: Making Progress on BC’s Climate Action Plan
- Sustainable Prosperity (University of Ottawa): BC’s Carbon Tax Shift: The First Four Years.
All images in this post are taken from the Making Progress on BC’s Climate Action Plan report.


Stephen Rees
I am very surprised that you have not mentioned that staggering increase in the carbon emissions that BC is ultimately responsible for. Yes the stuff burned in BC has declined – but we more than make up for that by the natural gas and coal we export. We are also a major outlet for exports of US coal. Those coal exports that you are currently so concerned about that might go through proposed new terminals in Washington now pass through Roberts Bank and Prince Rupert terminals – and both are being expanded.
The carbon tax is part of a shell game to distract – and you seem to have been caught by that.
Eric de Place
I don’t follow your reasoning. The carbon tax is not to blame for BC’s egregious fossil fuel exports. Quite the opposite, as Sightline and many others have pointed out, one way to rein in those exports would be to expand the carbon tax.
To me, the evidence from BC suggests that a carbon tax exerts a modest downward pressure on emissions. That’s an argument for expanding it—in scope in BC and in geographic reach to the US—not an argument for abandoning it.
Chad
It looks like both Quebec’s and Alberta’s GDP grew more than British Columbia’s. Did Quebec and Alberta also institute a carbon tax?
Eric de Place
Quebec actually does have a small carbon tax (and is rolling out a cap and trade program too). But the lesson of the chart is not that carbon pricing is required to grow an economy, but that it is not inconsistent with economic growth at a faster-than-national rate. Pretty cool, I think.
Aldyen Donnelly
This report is highly misleading.
BC’s carbon tax was introduced in July, 2008. From Jan 1 2008 through Dec 11, 2011, BC’s real provincial GDP growth rate ranked 10th out of 13 provinces and territories. According to Stats Canada, the national average real GDP growth was 10.15% over the period, while BC’s GDP grew only 9.16%. The rankings were:(1)Yukon-15.05%,(2)Sask-12.34%,(3)Nfld+Lab-12.03%,(4)Alberta-11.08%,(5)Manitoba 11.04%,(6)Nunavut-10.85%,(7)Quebec-10.72%,(8)NWT-10.39%, (9)Ontario-9.99%,(10)BC-9.16%,(11)New Brunswick-9.10%,(12)PEI-6.36%, and (13)Nova Scotia-6.36%. BC’s rank moves up only one place if we look at real GDP per capita instead of real GDP. By comparison, in most of the 4-year periods between 1998 and the introduction of the carbon tax, BC’s GDP growth rate ranked between #2 and #4 among Canadian provinces and territories.
In the author’s defence, he appears to be quoting the highly inaccurate recent reports of the Pembina Institute and Sustainable Prosperity. We should be able to trust the numbers published by these institutions. Unfortunately, we cannot.
You might also take a look at BC’s official GHG inventory alongside BC Finance’s carbon tax rate table. You will note that GHGs grew in most of the taxed energy use accounts. Less than 15% of the GHG reductions reported at the end of 2011, relative to 2007, occur in active accounts that are subject to the CTax. BC Hydro’s GHGs grew 1 million TCO2e, even though they are taxed. Most BC’s GHG reductions reflect manufacturing and service sector job losses. (BC’s 1st, 3rd, 5th and 6th largest industrial natural gas customers, who were also large diesel truck users, shut their doors between 2008 and 2011 and have not yet reopened. I would not argue that the CTax caused these job losses, but it cannot be reasonably argued, either, that the GHG reductions arising from these job losses should be credited to the CTax.)
BC’s CTax is NOT “revenue nuetral”, as BC’s Finance ministry directly acknowledges in BC’s Fiscal Plan. The CTax started taking more disposable income away from low income families than it was costing them roughly 18 months after the tax was introduced.
Note, as well, that when the CTax revenues are reported at $1.178 billion, this is a “gross” revenue estimate. Govt agencies, hospitals, schools, BC Ferries, BC Transit, community centres, etc. never paid income taxes but pay all energy taxes. All of the CTax $s collected from public sector institutions are included in the $1.178 billion in reported revenues. But BC either has to increase other taxes to cover the CTax-related increase in public sector operating costs or rebate CTax payments back to the public sector agencies to keep them whole. Also, companies pay Ctaxes out of pre-income tax revenues. That means that some 28% of the CTax they pay is offset by reduced income tax payments to the Province and the feds. And 100% of CTaxes paid by natural gas extraction enterprises is deducted from their royalties due, under BC’s “incentive” royalty system. It would be more honest to report net CTax revenues, which according to BC Finance has meant a new -$250,000 per year revenue loss for each year from 2008 through 2012, and that is BEFORE accounting for the Province’s CTax-related reduced royalty and corporate income tax streams or for any of the increased costs or CTax rebates to health care, social housing, educatino, etc.
There are many, many other major faults in the analysis. These reports would not typically get passing grades if they were handed in as first year Econ papers.
I am afraid if you care to understand the facts you have to look up the numbers at Stats Canada and BC Finance yourself. In particular, look at Finance’s CTax revenue forecast through 2015. It has CTax revenues increasing faster than population, even though it assumes no increase in the CTax rate. In other words, even the Minister of Finance is forecasting that the taxed emissions will grow, both absolutely and on a per capita basis, at least until 2015.
Aldyen Donnelly
Sorry. In the above post I suggested that the Finance Ministry has reported that the CTax has resulted in a net loss of government revenues in the order of -$250,000 per year–and that does not include any accounting for CTax revenues collected from public sector operations, or the offseting reductions in royalties or income taxes that derive from the fact that CTaxes are deducted from revenues before companies calculate their royalties and income taxes due.
That was a mistake. The smallest annual net revenue loss the Ministry of Finance associates with BC’s income to CTax shift was in 2011/12. The net government revenue loss acknowledged by the Ministry is much larger for prior years.
When I add my best estimates of the share of the $1.178 billion in gross CTax revenues that is paid by public sector operations and offset by lower income tax and royalty payments to the Province, I estimate that for the year the Ministry acknowledges a -$250,000 million loss, BC’s overall net loss was actually somewhere between -$500 and -$600 million.
Aldyen Donnelly
Finally, BC has only recently published a provincial GHG inventory for 2010 and will not publish government’s estimate of 2012 GHGs until sometime in 2014. But we already have access to fuel use data for 2011 and 2012, as well as aluminum, cement, wood products, and other carbon-intensive commodity production levels, vehicle sales and registrations by model, and reasonable estimates of how much money households and businesses have spent on energy efficiency.
We can therefore say, with a very high degree of certainty, that BC’s 2012 reported GHG emissions will be back up above 2007 levels. This is simple arithmetic. Publishing a forecast that shows a further decline in BC GHGs through 2012 suggests that the author has not yet looked at the available energy use and industrial activity data for 2011 and 2012.
Eric de Place
I’ll happily take a closer look at fuel use and tax data. Thanks for the pointers.
To help guide my inquiries, can you point to any published analysis consistent with your argument here?
Aldyen Donnelly
Eric,
Sorry that I did not respond to your request months ago. I got busy and did not check back at this site to see your request.
Last week I wrote an OpEd that was published by tghe Financial Post on this topic (“Carbon pricing doesn’t work”, Nay 17, 2013). As an experiment, I committed to respond, as comprehensively and constructively as possible, to any comments that would be posted at the electronic version of the article. I actually got much more feedback/questions in my personal email inbox than on the FP website, and tried to publicly answer both the questions posted at the website and those that came into my inbasket in the comments that I posted to the article.
I included many data sources, as well as ideas about how to use than and what I think they show, in the comments I posted at the FP Comments site, http://opinion.financialpost.com/2013/05/07/carbon-pricing-doesnt-work/
I hope you might consider checking out the comments section at this URL (freely accessible, I think). Let me know if you find this helpful. If not, also let me know that and I will try to get other sources to you.