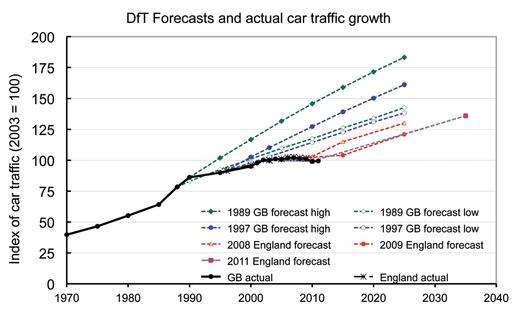
I’ve been a bit of a broken record about the fact that car traffic has been flat or declining in the Pacific Northwest. But it’s more than a Cascadian phenomenon. Gordon Price’s Price Tags blog spotlights this gem of a chart showing roughly flat traffic trends (in black) and traffic growth forecasts (in various colors), put together by transportation researcher Phil Goodwin.
Looks familiar, eh what?
In a similar vein, a new report from a British foundation takes a look at the Peak Car phenomenon in the UK, finding evidence that the flattening of traffic volumes in Britain represents a mix of contrasting trends. Men are driving less than they did a decade ago–particularly in the under-30 set, among whom driving has fallen by about 2,000 miles per year. Meanwhile, women are putting more miles on the road.
But perhaps most interesting is Gordon’s news about traffic trends in the city of Vancouver, BC–where the number of cars entering both city limits and the downtown area has been on the decline for years. See the charts in this report (pdf link), or just take a gander over at Gordon’s blog.
(Tip of the bowler to Joe C.)


Comments are closed.