When the Port of Vancouver, Washington rejected a recent coal export proposal the Port’s operations manager, Mike Schiller, explained that the economic fundamentals of coal are bad.
“Coal is the most risky bulk mineral market,” is how Schiller put it.
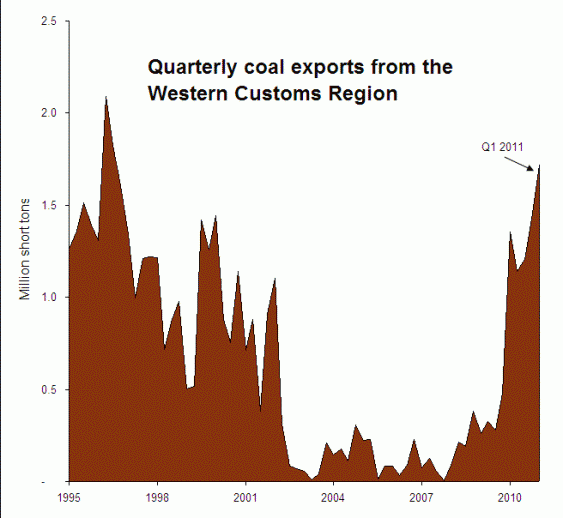
To find out what he meant, I did a little digging into the US Department of Energy’s quarterly coal export figures, which are kept online for each customs district in the country as far back to 1995. Here’s what the last 15 years has looked like for the region that covers the whole of the West Coast:
It’s not exactly the picture of stability. There’s a tremendous amount of volatility from quarter to quarter—suddenly doubling or tripling in volume, only to come crashing down just as quickly. The long-term trend is hardly more comforting.
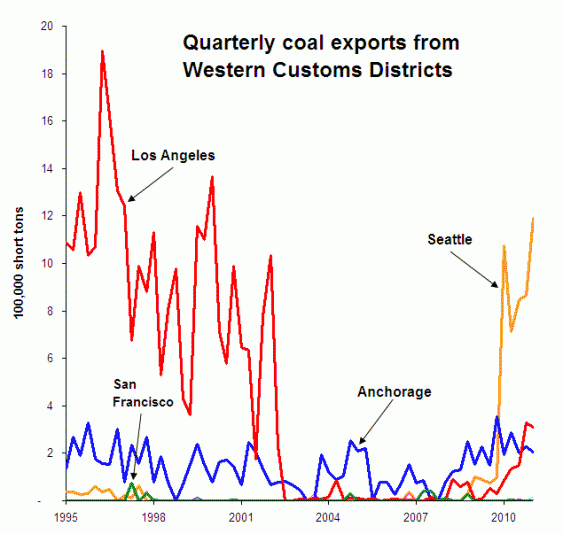
Let’s take a closer look at the individual customs districts within the Western region:
The Western Region is comprised of nine districts, just four of which have reported meaningful levels of coal exports during the last 15 years. San Francisco’s district, which covers all of northern California, barely registers here. The Anchorage district’s exports are presumably driven by the Usibelli Coal Mine’s relatively modest shipments out of Seward. The jagged trend line for the Los Angeles Customs District gives a pretty good indication of coal’s volatility and ultimate demise there. In fact, almost all of that district’s coal was shipped out of the storied disaster that was the LAXT coal terminal.
The trend line for the Seattle Customs District reveals the recent spike in Powder River Basin coal traffic that’s moving north into Canada for onward shipment to Asia from BC’s Westshore Terminal. (Seattle’s district encompasses all of northwest Washington, and more.) For now, federal data only allow us to see what’s happened through the end of March 2011, so I’ll update these charts when new figures are available.
As the Customs’ figures demonstrate, the West Coast has a checkered history with coal exports. And as we know from studying the region’s history, communities invested in new coal facilities only to watch them implode, expensively, when the markets turned against them.
Yet consider how small these historical figures are relative to what’s now proposed for the Northwest’s ports. Over the last 15 years, quarterly coal exports have seldom exceeded 1.5 million tons from the entire West Coast. But if the Longview and Cherry Point coal facilities become reality, the Northwest alone could easily see 10 or 20 times that amount of coal shipped each quarter. The proposed figures that are so far off the charts—literally—that adding them here would have rendered the historical trends illegible.
Notes: A big thanks to Pam MacRae for research assistance. All coal export data come from the US Energy Information Administration’s “Quarterly Coal Reports.” In addition to the districts identified in the second chart, the Western Customs Region also includes the districts of the Lower Columbia-Snake (centered on Portland, Oregon); Great Falls, Montana; Nogales, Arizona; Honolulu; and San Diego. These districts have reported virtually no coal exports since 1995. (The one exception is Great Falls, which reported an unprecedented uptick for the first quarter of 2011.) More detailed definitions for the Customs’ geographies can be found starting on page 21 of this pdf.


