An essay by philosopher Harry Frankfurt, first published in the mid-1980s but re-released in book form in 2005, offered what was perhaps the first serious analysis of a topic near and dear to any political observer’s heart: bullshit. Frankfurt argues that bullshit differs from lies in one important way. The liar believes that there IS such a thing as the truth: it’s the thing that the lie is designed to conceal. In contrast, a bullshitter has no regard for the very idea of truth. To a true bullshit artist, words are little more than a tool to achieve some arbitrary purpose — to seem informed, for example, or to manipulate other people so that they’ll do what you want them to. Whether words are true or false is beside the point; all that matters to the bullshitter is the effect that his or her words achieve.
Frankfurt’s essay came to mind when I read a WSDOT spokesperson’s recent article about traffic growth on the SR-520 bridge across Lake Washington. The spokesperson was responding, indirectly, to one of my previous posts pointing out that WSDOT data shows zero traffic growth across the SR 520 bridge for the last 15 years. Here’s his rebuttal:
[Sightline’s] analysis didn’t capture a complete picture of traffic on the corridor. Its analysis starts in 1996, the peak year of growth and traffic over the last 25 years, and continued through 2010, capturing the dot-com bust between 2000 and 2003 and the subsequent national recession, both with significant traffic effects in this region.
In contrast, the Washington State Department of Transportation’s (WSDOT) longer view of traffic data on the SR 520 bridge begins in 1984 and projects to the year 2030, capturing nearly 30 years of historical data to produce a more accurate trend. Traffic generally rose annually since 1984, until the beginning of economic uncertainty in the middle of the 2000s.
WSDOT’s response is about as pure an example of B.S. as one is likely to find in public discourse. Let’s break it down, point by point.
- [Sightline’s] “analysis didn’t capture a complete picture of traffic on the corridor”. B.S. I have, in fact, looked at traffic trends in the complete cross-Lake Washington corridor, including both SR 520 and I-90. As far as I can tell, the corridor-wide trends tell essentially the same story as the SR-520-only trends: a long-term flat-lining of traffic across Lake Washington. For I-90, the flat-lining started in about 1998.
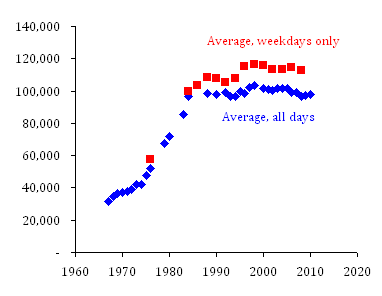
- “Its analysis starts in 1996.” B.S. I did, in fact, consider the traffic trends prior to 1996. They show rapid growth through the mid-1980s, slow and intermittent growth from the mid-1980s to the mid-1990s, and then a flattening out of traffic (or possibly a slight decline) starting in the mid-to-late 1990s. Here’s a long-term chart of daily traffic, showing two different WSDOT data series, one for weekdays only and another with averages for all days of the week. (But please see my caveats about the numbers at the end of this post!)

- “1996, the peak year of growth and traffic over the last 25 years.” B.S. For both WSDOT data series, the nominal peak in SR-520 cross-lake traffic occurred in 1998, not 1996 — a fact that would have been easy to ascertain if the WSDOT spokesperson had actually looked through his own agency’s data. But regardless of whether the nominal peak occurred in 1996 or 1998, the data show essentially the same thing: traffic hasn’t budged in well over a decade.
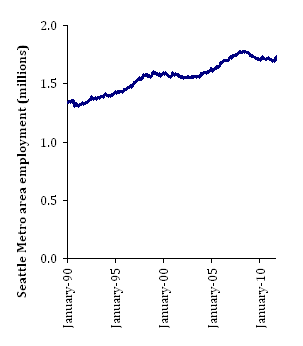
- “capturing the dot-com bust between 2000 and 2003 and the subsequent national recession, both with significant traffic effects in this region.” That’s bullshit — not because it’s false, but because it’s selective and misleading. The years of flat traffic on SR-520 include not only busts (2000-2002, 2008-2010) but also booms, including the hot dot-economy of the late 1990s and the years of steadily rising employment from about 2003 through mid-2008. (See the chart of metro-Seattle employment trends to the right.) By attributing the flat-lining of traffic to economic busts, WSDOT implies that traffic will grow again once the economy picks up. But that ignores the fact that traffic remained flat through extended economic booms in the 1990s and 2000s. That sort of selective use of evidence is classic B.S.
- “In contrast, the Washington State Department of Transportation’s (WSDOT) longer view of traffic data on the SR 520 bridge begins in 1984” B.S. To me, this sentence implies that WSDOT traffic forecasters looked at traffic trends on SR-520 from 1984 through 2010, and used those traffic trends to extrapolate future growth. But that’s not how those projections are made. WSDOT (or its consultants) use a traffic model for all of Puget Sound that extrapolates traffic volumes in general, based on projections for employment, population, and income growth. The model then assigns trips to various destinations, modes, and roadways, and is customized to give a finer-grained look at the 520 project area. (For more details, see chapters 3 and 4 of the transportation section of the SR-520 Final EIS.) But the regional traffic model has done a notably poor job of predicting recent traffic trends, both in general and on specific roads. In particular, the model tends to over-assign traffic to roads that have actually reached saturation. Regardless, the SR 520 projections aren’t based on a “longer view of traffic data on the SR 520 bridge,” but on a much more complicated model that assigns traffic to SR 520 in ways that can essentially ignore real-world traffic trends on the bridge.
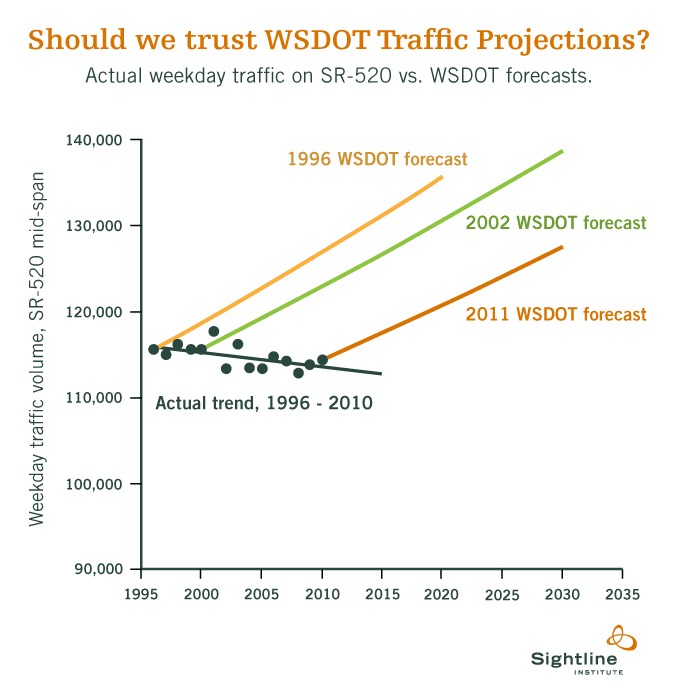
- “capturing nearly 30 years of historical data to produce a more accurate trend.” There is no evidence that “capturing nearly 30 years of historical data” actually helped WSDOT produce “a more accurate trend.” Indeed, as the chart in the original post (below) shows, WSDOT’s traffic projection methods have resulted in a series of forecasting fiascoes. As I’ve said before, the 1996 projection was completely forgivable; and you can even excuse the 2002 projections, since memories of rapid traffic growth were still fresh. But by 2011, it has become abundantly clear that WSDOT’s traffic projections aren’t passing the laugh test. Besides, claiming that a trend is “more accurate” before it’s been confirmed by actual events is B.S. of a particularly noxious sort.

- “Traffic generally rose annually since 1984, until…the middle of the 2000s.” Ungrammatical, but still B.S. WSDOT’s Annual Traffic Report found year-over-year traffic declines in 1993, 1996, 2000, 2001, 2002, 2004, 2005, 2006, 2007, and 2008. WSDOT’s Ramp and Roadway Report is only released every other year, but found biennial declines in 1990, 1992, 2000, 2002, and 2008. Similarly, the Seattle DOT reports data only for 1996 through 2004, but found year-over-year traffic declines in 1997, 1999, 2000, 2002, and 2004. In short, traffic generally rose annually until the middle of the 1990s, after which came a mixture of slight increases and slight decreases, depending on which year and which data source you look at.
- “the beginning of economic uncertainty in the middle of the 2000s.” Gaah! Greater Seattle’s economy was humming along nicely in the middle of the 2000s, with employment rising and unemployment rates occasionally dipping under 4 percent. Employment didn’t start to fall in earnest until late 2008. (See the employment chart, above.) It’s like WSDOT isn’t even trying to get the facts right!
Frankfurt’s essay was intended as a warning. He believed that B.S. does more damage to public discourse than lying, because bullshit undermines the very idea of truth as a useful concept. But if anything, WSDOT has ignored the cautionary notes in Frankfurt’s essay, and instead has decided to interpret “On Bullshit” as an instruction manual.
(Wonk alert: be careful with data from 1988 through 1990. From what I can tell from the archived pdfs, that’s when WSDOT transitioned from measuring traffic counts by counting axles to counting vehicles — so the numbers in those years are a bit screwy. I have chosen to omit two data points from the Annual Traffic Report series during that period, because they seem to be anomalies and WSDOT stopped reporting data for one of those years in subsequent editions of the report. In short, there’s reason to view traffic trends in the late 1980s and early 1990s with some skepticism, and the numbers before and after 1990 may not be directly comparable.)


Matt the Engineer
Scathing.
Your final chart is still one of my favorite charts ever. It’s so good because WADOT is so visibly bad at prediction. I think we’re seeing a little bit into the agency with an essay like this. It feels like whoever is driving the car is facing the wrong direction.
Bill Bradburd
instead of taking a meat cleaver to social services and schools, the state should take the action against WSDOT…
John Bailo
Based on really long term historical trends, Seattle Metro population should take a calamitous plunge in the next decade similar to the 1940s.
Clark Williams-Derry
🙂
Also, based on my own personal long-term trends, I will become 12 feet tall by the time I’m 88. Yes, my height has been stable since I was 19. But I grew a lot from age 0 to age 19 — and a longer-term look at the numbers gives a more accurate assessment of future trends!
Scrawny Kayaker
Did WSDOT rebuild their model after the 1996 forecast and after the 2002 forecast, or do they just keep turning the crank on the same broken machine? REAL mathematical modelers understand that if the model produces a result that does not agree with reality, either the model is invalid and has to be recreated with new assumptions, or the problem is intractable because the data are incomplete or chaotic. Do they even PRETEND to address the fact that they’ve got a history of failure, or is just “we have a model!”
Chad N
In defense of WSDOT (I position I don’t normally take), could the projections of SR520 bridge traffic growth be applicable to latent demand? As in, traffic volumes have been stable since the late 1990’s because the bridge is essentially at capacity. But if more lanes were made available, traffic volume could grow to meet WSDOT’s 2030 projections. Its the well-known process of induced demand.
This leads to circular logic: WSDOT must expand capacity because traffic modeling shows that a larger road would attract more traffic.
Clark Williams-Derry
That’s a position that WSDOT could legitimately take: “models show that, if there were more road space, more people would drive on 520.” It’s a bit circular, but not insane: presumably, people driving on 520 would be getting some benefit from the trip.
But that’s not the position they do take. Instead, they say: Projected traffic will happen, new bridge or no. And if we don’t widen the bridge, it’ll mean horrific congestion from 4 a.m. to 9 p.m. (or somesuch) to accommodate all the extra trips. Traffic will back up to I-405; it’ll be traffic-mageddon. Etc.
In short, the agency COULD try to make some reasonable and responsible case about latent demand, and let the public decide if the opportunity costs of stifling latent demand outweigh the cost of new roads. Instead, WSDOT uses model results to raise unrealistic alarms about imminent hyper-congestion — and the only thing I can think is that they’re doing their best to influence public opinion in favor of multi-billion dollar highway projects that are otherwise hard to justify.
Which means they’ve crossed over from being honest brokers of the public good to old-fashioned highway construction boosters.
Scott Walker
I am joyous in the growing exposure Sightline is giving to the DOT. DOT likes to wear the cloak of “just doing what the public wants” while undermining all community work toward sustainability. With the dedicated gas tax, which is one of the only secure sources of revenue for any government operation these days, they are just another arm of the machine that’s sucking wealth out of all of us, destroying communities, corrupting politics, and unraveling the ecosystem of the Earth. The name change from Highway Department to Transportation Department has not yet brought them from asphalt and cars into building community through good transportation options. They plan for cars and traffic and get cars and traffic. Maybe enough exposure to their corruption will change their ways.
Keep connecting the DOTs, Sightline!
Southender
Maybe Michael Horntvedt, the traffic operations and modelling lead for the SR520 project, would be willing to to engage in an intellectually honest discussion on the topic. However, that hasn’t been my experience with him.
Nathanael
“Maybe Michael Horntvedt, the traffic operations and modelling lead for the SR520 project, would be willing to to engage in an intellectually honest discussion on the topic. However, that hasn’t been my experience with him.”
Thank you, Southender, for naming names.
When people are purveying bullshit for evil purposes, it’s important to name them so that they can be demonized, blacklisted, and have their careers destroyed. (I’m quite serious about this. It seems to be the only way to get these slimy liars out of power.)
H. Pike Oliver
Thanks for a well-reasoned and, just as important, well-written analysis enhanced by clear graphics. Given how little it costs relative to the capital investment, there is no logical reason transportation analysis at public agencies to remain as primitive as it is. We, and the Governor need to insist on a more sophisticated and nuanced approach. And, to be fair, there is also room for improvement at transit agencies.
Nathanael
Thank you for exposing the duplicity and dishonesty of WSDOT. What next? I think perhaps it’s important for the facts about this duplicity and dishonesty to get in the hands of WSDOT’s *bosses* in the state legislature and governor’s office…. WSDOT needs to be ordered to project traffic based on actual trends rather than based on bullshit.
Eric Evans
Does anyone know where I can get accurate traffic data along the SR-99 viaduct from 1970-2009 or at least 2000-2009. Working on a case study and I am having a hard time finding data simply on how many vehicles traveled along the viaduct and the area along the SR-99 between these years.
Thanks,
Eric